12.5 Graphs of 1/f(x) and [f(x)]²
AHL 2.16
- how to sketch the reciprocal graph \(y = \dfrac{1}{f(x)}\) from the graph of \(y = f(x)\)
- what happens to zeros, asymptotes, turning points and the direction of the curve
- how to sketch \(y = [f(x)]^2\) from the graph of \(y = f(x)\)
The graph of \(y = \dfrac{1}{f(x)}\)
To draw \(y = \frac{1}{f(x)}\), think about what happens to each \(y\)-value \(f(x)\) when we take its reciprocal.
- Sign: \(\frac{1}{f(x)}\) has the same sign as \(f(x)\). Parts above the \(x\)-axis stay above; parts below stay below.
- Zeros become asymptotes: if \(f(d) = 0\), then \(\frac{1}{f(d)}\) is undefined. The line \(x = d\) is a vertical asymptote.
- Asymptotes become zeros: if \(f(x) \to \pm\infty\) near \(x = a\), then \(\frac{1}{f(x)} \to 0\). The point \((a, 0)\) is on the new graph (if \(\frac{1}{f}\) is defined there).
- Big becomes small, small becomes big: as \(|f(x)|\) gets larger, \(\left|\frac{1}{f(x)}\right|\) gets smaller, and the other way round.
- Invariant points: where \(f(x) = 1\) or \(f(x) = -1\), the reciprocal is the same value. These points do not move.
So we divide the graph of \(y = f(x)\) into pieces separated by the new vertical asymptotes, and change each piece using the table below.
From \(y = f(x)\) to \(y = \dfrac{1}{f(x)}\) Not in the formula booklet
| Feature | On \(y = f(x)\) | On \(y = \dfrac{1}{f(x)}\) |
|---|---|---|
| Turning points (\(k \neq 0\)) | maximum \((h, k)\) | minimum \(\left(h, \dfrac{1}{k}\right)\) |
| minimum \((h, k)\) | maximum \(\left(h, \dfrac{1}{k}\right)\) | |
| Zeros | \(x\)-intercept \((d, 0)\) | vertical asymptote \(x = d\) |
| Vertical asymptotes | \(x = a\) | \(x\)-intercept \((a, 0)\) |
| Horizontal asymptotes | \(y = c\), \(\;c \neq 0\) | \(y = \dfrac{1}{c}\) |
| \(y = 0\) | \(\left\lvert\dfrac{1}{f(x)}\right\rvert \to \infty\) | |
| \(f(x) \to \pm\infty\) as \(x \to \pm\infty\) | horizontal asymptote \(y = 0\) | |
| Direction | increasing (going up) | decreasing (going down) |
| decreasing (going down) | increasing (going up) | |
| Points with \(y = \pm 1\) | \((p, 1)\) or \((p, -1)\) | invariant |
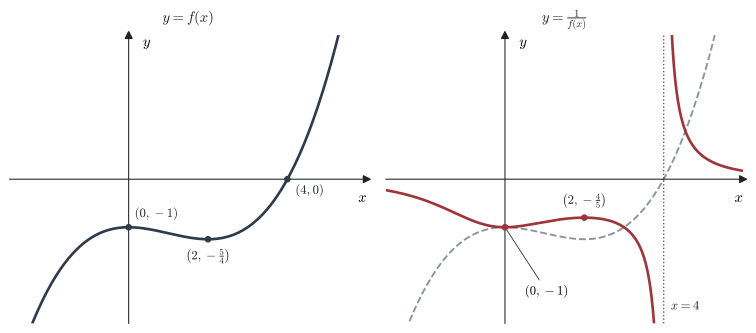
Example 1 The graph of \(y = f(x)\) crosses the \(x\)-axis only at \((4, 0)\) and crosses the \(y\)-axis at \((0, -1)\). It has a maximum point \((0, -1)\) and a minimum point \(\left(2, -\frac{5}{4}\right)\). Sketch the graph of \(y = \dfrac{1}{f(x)}\).
- Zero at \(x = 4\) \(\Rightarrow\) vertical asymptote \(x = 4\).
- \(f(x) \to \pm\infty\) as \(x \to \pm\infty\) \(\Rightarrow\) horizontal asymptote \(y = 0\) on both sides.
- Maximum \((0, -1)\) \(\Rightarrow\) minimum \(\left(0, \frac{1}{-1}\right) = (0, -1)\). This point is invariant (\(y = -1\)). It is also the \(y\)-intercept.
- Minimum \(\left(2, -\frac{5}{4}\right)\) \(\Rightarrow\) maximum \(\left(2, -\frac{4}{5}\right)\).
- For \(x < 4\), \(f(x) < 0\), so the new graph is below the axis. As \(x \to 4^-\), \(f(x) \to 0^-\), so \(\frac{1}{f(x)} \to -\infty\).
- For \(x > 4\), \(f(x) > 0\) and increasing, so \(\frac{1}{f(x)}\) comes down from \(+\infty\) towards \(0\).
Example 2 The graph of \(y = f(x)\) is a parabola through \(O\) and \((2, 0)\), with maximum point \((1, 2)\). The graph of \(y = g(x)\) has asymptotes \(x = -1\), \(x = 3\) and \(y = 1\), a maximum point \((1, -2)\) and \(y\)-intercept \((0, -3)\). The graph of \(y = g(x)\) does not meet the \(x\)-axis.
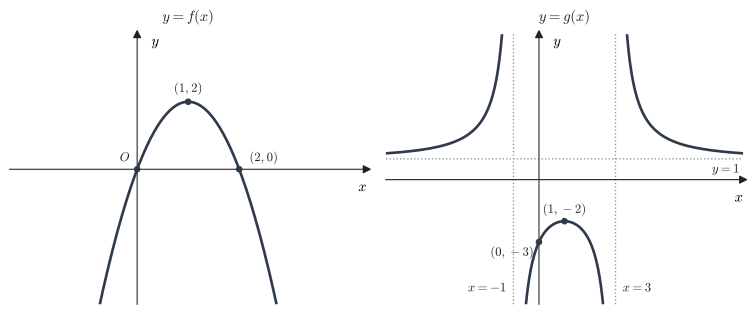
Sketch the graphs of \(y = \dfrac{1}{f(x)}\) and \(y = \dfrac{1}{g(x)}\).
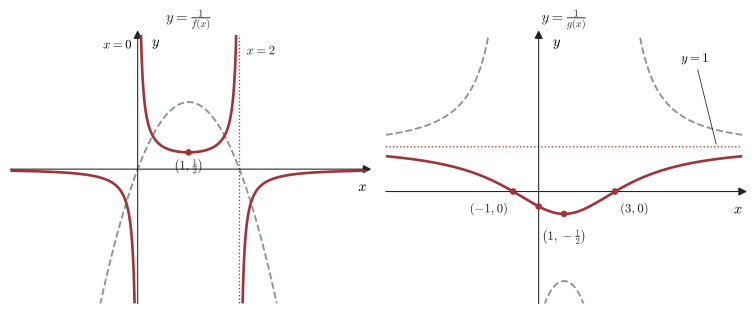
\(y = \dfrac{1}{f(x)}\)
- Zeros at \(x = 0\) and \(x = 2\) \(\Rightarrow\) vertical asymptotes \(x = 0\) and \(x = 2\).
- Maximum \((1, 2)\) \(\Rightarrow\) minimum \(\left(1, \frac{1}{2}\right)\).
- Outside \(0 < x < 2\), \(f(x) < 0\) and \(f(x) \to -\infty\), so \(\frac{1}{f(x)}\) is negative and tends to \(0\): asymptote \(y = 0\).
\(y = \dfrac{1}{g(x)}\)
- \(g(x)\) is never zero, so there are no vertical asymptotes.
- Asymptotes \(x = -1\) and \(x = 3\) of \(g\) \(\Rightarrow\) \(x\)-intercepts \((-1, 0)\) and \((3, 0)\).
- Asymptote \(y = 1\) \(\Rightarrow\) asymptote \(y = \frac{1}{1} = 1\). Since \(g(x) > 1\) on the outer branches, \(\frac{1}{g(x)}\) is between \(0\) and \(1\) there.
- Maximum \((1, -2)\) \(\Rightarrow\) minimum \(\left(1, -\frac{1}{2}\right)\). \(y\)-intercept \((0, -3) \Rightarrow \left(0, -\frac{1}{3}\right)\).
On a Graphs page, enter your function as \(f_1(x)\) and then \(f_2(x) = \dfrac{1}{f_1(x)}\). Use Menu → Window / Zoom → Zoom – Fit, or set the window yourself, so that the small values of \(f_2\) are visible. Menu → Analyze Graph → Minimum / Maximum confirms the turning points. Remember that the calculator may draw a near-vertical line at an asymptote; it is not part of the graph.
The graph of \(y = [f(x)]^2\)
Squaring a number makes it non-negative, makes numbers between \(-1\) and \(1\) smaller in size, and makes numbers bigger than \(1\) in size larger.
From \(y = f(x)\) to \(y = [f(x)]^2\) Not in the formula booklet
- The graph is on or above the \(x\)-axis everywhere.
- Points with \(y = 0\) or \(y = 1\) are invariant. (Points with \(y = -1\) move up to \(y = 1\).)
- The graph touches the \(x\)-axis at each \(x\)-intercept of \(y = f(x)\) (a smooth minimum, not a sharp point).
- Vertical asymptotes of \(y = f(x)\) are also vertical asymptotes of \(y = [f(x)]^2\). A horizontal asymptote \(y = c\) becomes \(y = c^2\).
- Where \(-1 < f(x) < 1\), the new graph is closer to the \(x\)-axis than \(y = f(x)\).
- Where \(|f(x)| > 1\), the new graph is further from the \(x\)-axis than \(y = f(x)\).
- A turning point \((h, k)\) becomes \((h, k^2)\).
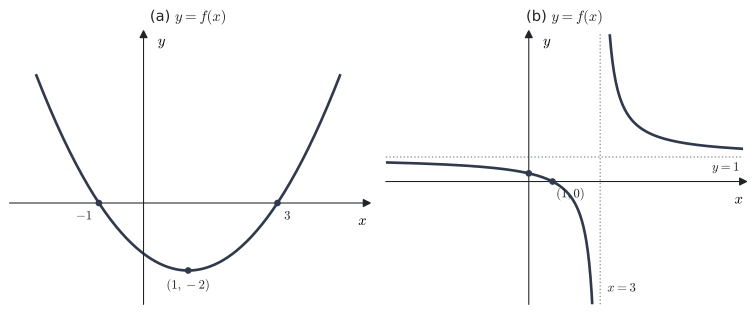
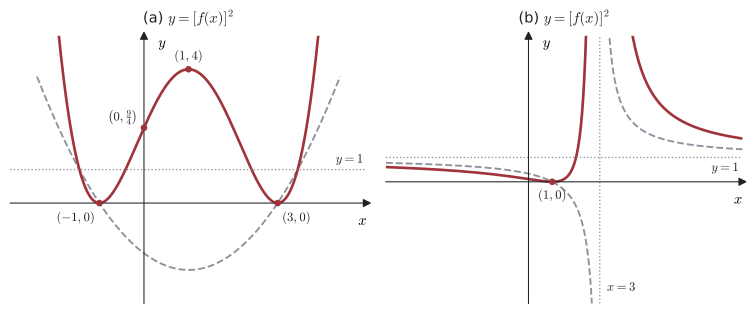
Example 3 For each graph of \(y = f(x)\), sketch the graph of \(y = [f(x)]^2\).
(a) A parabola with roots \(-1\) and \(3\), vertex \((1, -2)\) and \(y\)-intercept \(\left(0, -\frac{3}{2}\right)\).
(b) A curve with asymptotes \(x = 3\) and \(y = 1\), \(x\)-intercept \((1, 0)\) and \(y\)-intercept \(\left(0, \frac{1}{3}\right)\).
(a)
- The graph touches the \(x\)-axis at \((-1, 0)\) and \((3, 0)\). These are minimum points.
- Vertex \((1, -2) \to (1, 4)\), now a maximum point.
- \(y\)-intercept \(\left(0, -\frac{3}{2}\right) \to \left(0, \frac{9}{4}\right)\).
- Near the roots \(|f(x)| < 1\), so the new graph is flatter there. It meets the line \(y = 1\) four times, where \(f(x) = \pm 1\).
(b)
- \(x = 3\) is still a vertical asymptote. On both sides the new graph goes up to \(+\infty\).
- \(y = 1\) becomes \(y = 1^2 = 1\).
- The graph touches the \(x\)-axis at \((1, 0)\).
- \(y\)-intercept \(\left(0, \frac{1}{3}\right) \to \left(0, \frac{1}{9}\right)\): here \(0 < f(x) < 1\), so the new graph is closer to the axis.
- On the right of \(x = 3\), \(f(x) > 1\), so the new graph is above \(y = f(x)\).
Common errors
| ✗ Wrong | ✓ Right | Why |
|---|---|---|
| \(\frac{1}{f(x)}\) has a vertical asymptote where \(f\) has an asymptote | It has an asymptote where \(f(x) = 0\) | You cannot divide by zero; dividing by a huge number gives nearly zero. |
| A maximum \((2, 4)\) of \(f\) gives a maximum \(\left(2, \frac{1}{4}\right)\) of \(\frac{1}{f}\) | It gives a minimum \(\left(2, \frac{1}{4}\right)\) | When \(f\) is largest, \(\frac{1}{f}\) is smallest. |
| \(\frac{1}{f(x)}\) is drawn on the other side of the \(x\)-axis | Same side as \(f(x)\) | \(f(x)\) and \(\frac{1}{f(x)}\) always have the same sign. |
| \([f(x)]^2\) has a sharp point at a root of \(f\) | It touches the axis smoothly | Squaring a small number gives a much smaller number, so the curve flattens. |
| \([f(x)]^2\) is always further from the axis than \(f(x)\) | Only where \(\lvert f(x) \rvert > 1\) | For example \(\left(\frac{1}{2}\right)^2 = \frac{1}{4} < \frac{1}{2}\). |
Exercises
1 Let \(f(x) = x - 2\). Sketch \(y = \dfrac{1}{f(x)}\), stating its asymptotes and its \(y\)-intercept.
\(f(2) = 0 \Rightarrow\) vertical asymptote \(x = 2\). \(|f(x)| \to \infty\) as \(x \to \pm\infty \Rightarrow\) horizontal asymptote \(y = 0\). \(y\)-intercept: \(\frac{1}{0 - 2} = -\frac{1}{2}\), so \(\left(0, -\frac{1}{2}\right)\).
2 Let \(f(x) = x^2 - 4\). Sketch \(y = \dfrac{1}{f(x)}\). Give the asymptotes and the turning point.
Zeros \(\pm 2\) \(\Rightarrow\) vertical asymptotes \(x = -2\) and \(x = 2\). \(f(x) \to \infty\) as \(x \to \pm\infty\) \(\Rightarrow\) asymptote \(y = 0\).
The minimum \((0, -4)\) of \(f\) becomes a maximum \(\left(0, -\frac{1}{4}\right)\). The middle branch is below the \(x\)-axis; the outer branches are above.
3 Let \(f(x) = x^2 + 1\). Sketch \(y = \dfrac{1}{f(x)}\) and state its range.
\(f(x) \ge 1 > 0\) for all \(x\), so there are no vertical asymptotes. The minimum \((0, 1)\) becomes a maximum \((0, 1)\) (invariant). As \(x \to \pm\infty\), \(\frac{1}{f(x)} \to 0^+\): asymptote \(y = 0\).
Range: \(0 < y \le 1\).
4 The graph of \(y = f(x)\) has a minimum point \((3, 5)\), a maximum point \((-1, -2)\), the \(x\)-intercept \((4, 0)\), and asymptotes \(x = 1\) and \(y = 2\). Write down the corresponding features of \(y = \dfrac{1}{f(x)}\).
Maximum \(\left(3, \frac{1}{5}\right)\); minimum \(\left(-1, -\frac{1}{2}\right)\); vertical asymptote \(x = 4\); \(x\)-intercept \((1, 0)\); horizontal asymptote \(y = \frac{1}{2}\).
5 Let \(f(x) = 2x + 4\). Sketch on separate diagrams
(a) \(y = \dfrac{1}{f(x)}\) \(\qquad\) (b) \(y = [f(x)]^2\)
giving the asymptotes, intercepts and turning points.
(a) Vertical asymptote \(x = -2\), horizontal asymptote \(y = 0\), \(y\)-intercept \(\left(0, \frac{1}{4}\right)\).
(b) \([f(x)]^2 = 4(x + 2)^2\): a parabola that touches the \(x\)-axis at its minimum \((-2, 0)\), with \(y\)-intercept \((0, 16)\).
6 Let \(f(x) = \mathrm{e}^x - 1\). For each graph, give the asymptotes and the axis intercepts.
(a) \(y = [f(x)]^2\) \(\qquad\) (b) \(y = \dfrac{1}{f(x)}\)
\(y = f(x)\) passes through \((0, 0)\), has the asymptote \(y = -1\) on the left and increases without limit on the right.
(a) Touches the \(x\)-axis at \((0, 0)\). Asymptote \(y = (-1)^2 = 1\) as \(x \to -\infty\). No other asymptotes.
(b) \(f(0) = 0 \Rightarrow\) vertical asymptote \(x = 0\). As \(x \to -\infty\), \(\frac{1}{f(x)} \to \frac{1}{-1} = -1\): asymptote \(y = -1\). As \(x \to \infty\), \(\frac{1}{f(x)} \to 0\): asymptote \(y = 0\). There are no axis intercepts.
7 Let \(f(x) = \ln x\), \(x > 0\). Describe the graph of \(y = \dfrac{1}{f(x)}\): its vertical asymptote, and what happens as \(x \to 0^+\) and as \(x \to \infty\).
\(\ln 1 = 0 \Rightarrow\) vertical asymptote \(x = 1\).
As \(x \to 0^+\), \(\ln x \to -\infty\), so \(\frac{1}{\ln x} \to 0^-\): the graph approaches the origin from below (but \((0, 0)\) is not on the graph).
As \(x \to \infty\), \(\ln x \to \infty\), so \(\frac{1}{\ln x} \to 0^+\): asymptote \(y = 0\).
8 Let \(f(x) = x^2 - 3\). Find the invariant points when the graph of \(y = f(x)\) is transformed to the graph of \(y = \dfrac{1}{f(x)}\).
Invariant points have \(f(x) = 1\) or \(f(x) = -1\).
\(x^2 - 3 = 1 \Rightarrow x = \pm 2\). \(\qquad x^2 - 3 = -1 \Rightarrow x = \pm\sqrt{2}\).
Invariant points: \((-2, 1)\), \((2, 1)\), \((-\sqrt{2}, -1)\), \((\sqrt{2}, -1)\).
9 Let \(f(x) = x^2 - 2x - 3\). Sketch \(y = [f(x)]^2\). Give the points where it touches the \(x\)-axis, the local maximum point and the \(y\)-intercept.
\(f(x) = (x + 1)(x - 3)\), vertex \((1, -4)\), \(y\)-intercept \((0, -3)\).
\(y = [f(x)]^2\) touches the \(x\)-axis at \((-1, 0)\) and \((3, 0)\). Local maximum \((1, 16)\). \(y\)-intercept \((0, 9)\).
10 Let \(f(x) = \dfrac{x - 1}{x + 2}\). Use the features of \(y = f(x)\) to find the asymptotes and axis intercepts of \(y = \dfrac{1}{f(x)}\). Check your answer by simplifying \(\dfrac{1}{f(x)}\).
\(y = f(x)\) has asymptotes \(x = -2\), \(y = 1\), \(x\)-intercept \((1, 0)\) and \(y\)-intercept \(\left(0, -\frac{1}{2}\right)\).
For \(y = \frac{1}{f(x)}\): vertical asymptote \(x = 1\); horizontal asymptote \(y = \frac{1}{1} = 1\); \(x\)-intercept \((-2, 0)\); \(y\)-intercept \((0, -2)\).
Check: \(\dfrac{1}{f(x)} = \dfrac{x + 2}{x - 1}\), which has exactly these features.