15.6 Symmetry, Skew and Outliers
SL 4.1 SL 4.2
- how to describe the shape of a distribution: symmetric, positively skewed or negatively skewed
- how to see the shape in a histogram and in a box plot
- how to decide whether data may be normally distributed from a box plot
- the IB definition of an outlier, and how to show outliers on a box plot
- how to interpret outliers in context
Symmetry
In many data sets the values gather around a central value, with no lean to the left or the right. Such data is symmetric: the left half of the histogram is roughly a mirror image of the right half.
Symmetric data Not in the formula booklet
- The mean and the median are roughly equal.
- In the box plot, the median is near the middle of the box, and the two whiskers have about the same length.
A uniform distribution is a special symmetric distribution in which every outcome has the same frequency. For example, if a fair die is rolled a very large number of times, each score appears about equally often, so the histogram becomes almost flat. (With only a few rolls, the histogram is usually irregular.)
Skew
A distribution that is not symmetric is skewed.
Positive and negative skew Not in the formula booklet
- Positive skew (skewed to the right): a long tail to the right. Most of the data is on the left. In the box plot the right whisker is longer, and the median is nearer to \(Q_1\). Usually mean \(>\) median.
- Negative skew (skewed to the left): a long tail to the left. Most of the data is on the right. In the box plot the left whisker is longer, and the median is nearer to \(Q_3\). Usually mean \(<\) median.
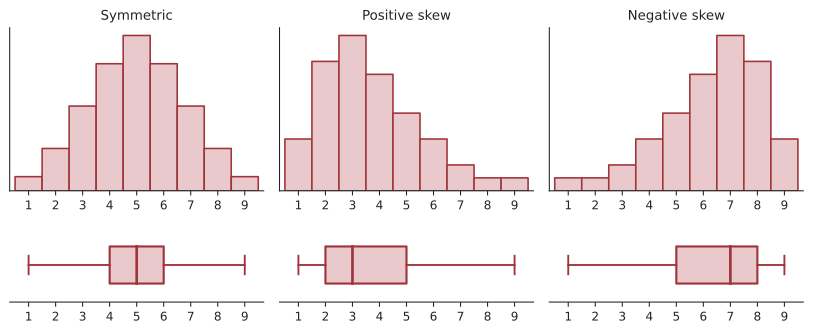
Incomes and house prices are often positively skewed: most values are moderate, but a few are very large. Marks in an easy test are often negatively skewed: most students score highly, and a few score low.
Is the data normally distributed?
The normal distribution (studied in Unit 19) is symmetric and bell-shaped, with most values near the middle and fewer values further away.
Normality from a box plot Not in the formula booklet
Data may be normally distributed if its box plot is symmetric: the median is in the middle of the box, the whiskers have equal length, and the whiskers are longer than each half of the box.
Data that is clearly skewed is unlikely to be normally distributed.
Outliers
An outlier is a value that is very different from the other values. It may be a mistake (a recording error, or a broken measuring instrument), or it may be a genuine but unusual value.
Outliers (IB definition) Not in the formula booklet
A data value is an outlier if it is more than \(1.5 \times \text{IQR}\) from the nearest quartile. So \(x\) is an outlier if
\[ x < Q_1 - 1.5 \times \text{IQR} \qquad \text{or} \qquad x > Q_3 + 1.5 \times \text{IQR} . \]
On a box plot, mark each outlier with a cross (\(\times\)). The whisker then goes only to the last value that is not an outlier.
- \(\text{IQR}\): the interquartile range, \(Q_3 - Q_1\)
- \(x\): a data value
- \(Q_1\): the lower quartile
- \(Q_3\): the upper quartile
Only \(\text{IQR} = Q_3 - Q_1\) is in the booklet.
There can be more than one outlier, at either end.
Example 1 The heights, in cm, of 11 sunflowers are:
\[ 152,\ 148,\ 160,\ 155,\ 145,\ 163,\ 150,\ 157,\ 149,\ 171,\ 154 \]
(a) Find the five-number summary. Show that there are no outliers.
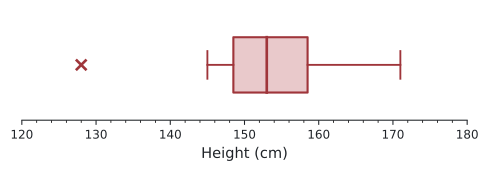
(b) A twelfth sunflower is 128 cm tall. Determine whether 128 is an outlier.
(c) Draw a box plot of all 12 heights.
(a) In order: \(145, 148, \mathbf{149}, 150, 152, \mathbf{154}, 155, 157, \mathbf{160}, 163, 171\).
Median \(= 154\); \(\;Q_1 = 149\) (median of \(145, 148, 149, 150, 152\)); \(\;Q_3 = 160\) (median of \(155, 157, 160, 163, 171\)).
Five-number summary: \(145, 149, 154, 160, 171\). IQR \(= 11\), so \(1.5 \times 11 = 16.5\).
Boundaries: \(149 - 16.5 = 132.5\) and \(160 + 16.5 = 176.5\). All values are between these, so there are no outliers.
(b) Now \(n = 12\): \(128, 145, 148, 149, 150, 152, 154, 155, 157, 160, 163, 171\).
\(Q_1 = \dfrac{148 + 149}{2} = 148.5\), \(\;Q_3 = \dfrac{157 + 160}{2} = 158.5\), IQR \(= 10\), median \(= \dfrac{152 + 154}{2} = 153\).
Lower boundary: \(148.5 - 1.5 \times 10 = 133.5\). Since \(128 < 133.5\), 128 is an outlier.
(c) Mark 128 with a cross. The lower whisker ends at \(145\), the smallest value that is not an outlier.
Outliers in context
Do not remove an outlier automatically. Ask why it is so different.
- A recorded height of \(17.1\) m for a student is clearly an error — it should be corrected or removed.
- A sunflower of 128 cm may be a genuine value (for example, it grew in shade) — it is a valid part of the data.
Outliers have a big effect on the mean, the range and the standard deviation, but only a small effect on the median and the IQR.
Example 2 Match each box plot with the histogram of the same data.
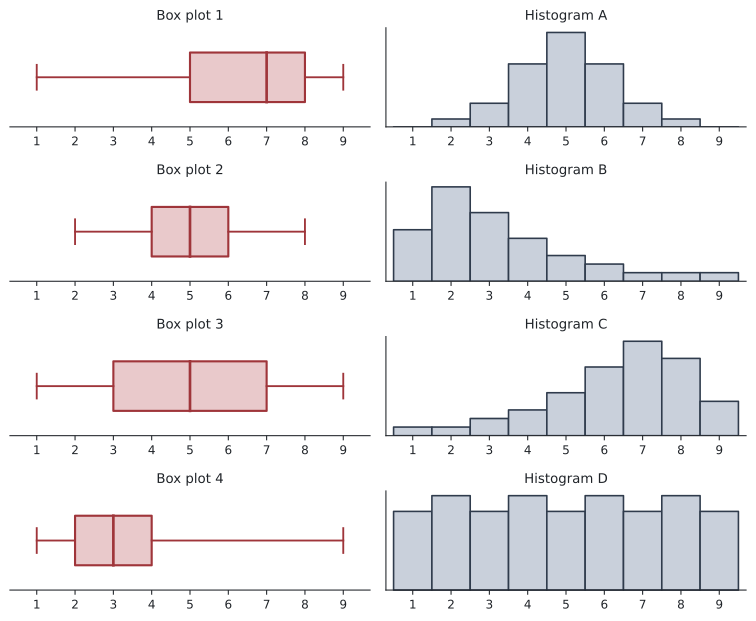
- Histogram A is symmetric with most values close to 5: a short, central box. This is Box plot 2.
- Histogram B has positive skew (long right tail): a long right whisker. This is Box plot 4.
- Histogram C has negative skew (long left tail): a long left whisker. This is Box plot 1.
- Histogram D is almost uniform: the data is spread evenly, so the box is wide and the median is in the middle. This is Box plot 3.
Example 3 The five-number summaries of two data sets are given. For each one, describe the shape and say whether the data may be normally distributed.
(a) \(20, \; 34, \; 40, \; 46, \; 60\)
(b) \(20, \; 24, \; 28, \; 40, \; 70\)
(a) Whiskers: \(34 - 20 = 14\) and \(60 - 46 = 14\). Halves of the box: \(6\) and \(6\). The box plot is symmetric, with whiskers longer than the half-boxes, so the data may be normally distributed.
(b) Halves of the box: \(4\) and \(12\); whiskers: \(4\) and \(30\). The right side is much longer, so the data is positively skewed and is unlikely to be normally distributed. (Also \(Q_3 + 1.5 \times \text{IQR} = 40 + 24 = 64 < 70\), so the maximum is an outlier.)
Common errors
| ✗ Wrong | ✓ Right | Why |
|---|---|---|
| “Positive skew: the peak is on the right” | The tail is on the right; the peak is on the left | Skew is named after the direction of the long tail. |
| Outlier if more than \(1.5 \times \text{IQR}\) from the median | From the nearest quartile | The rule uses \(Q_1\) and \(Q_3\). |
| A value exactly \(1.5 \times \text{IQR}\) from \(Q_3\) is an outlier | Only more than \(1.5 \times \text{IQR}\) | The inequality is strict. |
| Whisker drawn to the outlier | Whisker to the last non-outlier, outlier marked \(\times\) | IB box plots show outliers separately. |
| Always delete outliers | Decide in context: error or genuine? | Some outliers are a valid part of the data. |
Exercises
1 Describe the shape of each distribution from its five-number summary.
(a) \(10, 20, 24, 27, 30\)
(b) \(5, 8, 10, 15, 30\)
(c) \(2, 6, 10, 14, 18\)
(a) Left whisker \(10\), right whisker \(3\); median nearer \(Q_3\): negative skew.
(b) Left whisker \(3\), right whisker \(15\); median nearer \(Q_1\): positive skew.
(c) All four parts have length \(4\): symmetric.
2 Find any outliers in: \(14, 17, 18, 19, 20, 21, 22, 23, 25, 41\).
\(n = 10\). Lower half \(14, 17, \mathbf{18}, 19, 20\): \(Q_1 = 18\). Upper half \(21, 22, \mathbf{23}, 25, 41\): \(Q_3 = 23\). IQR \(= 5\).
Boundaries: \(18 - 7.5 = 10.5\) and \(23 + 7.5 = 30.5\). 41 is an outlier.
3 A data set has \(Q_1 = 32\) and \(Q_3 = 44\). Which of the values \(10, 14, 60, 63\) are outliers?
IQR \(= 12\), \(1.5 \times 12 = 18\). Boundaries: \(32 - 18 = 14\) and \(44 + 18 = 62\).
\(10 < 14\): outlier. \(14\) is not more than \(18\) below \(Q_1\): not an outlier. \(60 < 62\): not an outlier. \(63 > 62\): outlier.
4 The salaries of the employees of a company are positively skewed. Which is likely to be larger, the mean or the median? Which average would the employees prefer to quote to show that pay is low?
The few very large salaries pull the mean up, so the mean is likely to be larger than the median. To show that pay is low, the employees would quote the median.
5 For the data \(3, 21, 22, 24, 25, 26, 27, 28, 30, 31, 33\):
(a) find the five-number summary,
(b) show that there is exactly one outlier,
(c) state where the lower whisker should end on a box plot.
(a) Median \(= 26\); \(Q_1 = 22\); \(Q_3 = 30\). Summary: \(3, 22, 26, 30, 33\).
(b) IQR \(= 8\); boundaries \(22 - 12 = 10\) and \(30 + 12 = 42\). Only \(3 < 10\), so \(3\) is the only outlier.
(c) At \(21\), the smallest value that is not an outlier (\(3\) is marked with a cross).
6 The box plot of a data set has \(Q_1 = 15\) and \(Q_3 = 27\). Find the range of values that are not outliers.
IQR \(= 12\), \(1.5 \times 12 = 18\). Values from \(15 - 18 = -3\) to \(27 + 18 = 45\) are not outliers: \(-3 \le x \le 45\).
7 In a survey of the number of hours students sleep per night, the values \(7.5\), \(8\), \(3\) and \(80\) appear. For each of \(3\) and \(80\), say whether it is more likely to be an error or a genuine value.
\(80\) hours is impossible in one night: it is an error (perhaps \(8.0\)). It should be corrected or removed. \(3\) hours is unusual but possible: it may be a genuine value and should be kept unless there is a reason to doubt it.
8 For a data set, \(Q_3 = 50\) and the value \(80\) is exactly on the upper outlier boundary. Find the IQR and \(Q_1\).
\(50 + 1.5 \times \text{IQR} = 80 \Rightarrow \text{IQR} = 20\), so \(Q_1 = 50 - 20 = 30\).
9 Two box plots have five-number summaries A: \(5, 9, 12, 15, 19\) and B: \(5, 6, 8, 13, 19\). Which data set may be normally distributed? Explain.
A: whiskers \(4\) and \(4\), half-boxes \(3\) and \(3\): symmetric, so A may be normal. B: half-boxes \(2\) and \(5\), whiskers \(1\) and \(6\): positively skewed, so B is unlikely to be normal.
10 The data set \(12, 14, 15, 16, 17, 46\) is given.
(a) Show that \(46\) is an outlier.
(b) Find the mean and median with and without \(46\). Comment.
(a) \(Q_1 = 14\), \(Q_3 = 17\), IQR \(= 3\). Upper boundary \(17 + 4.5 = 21.5 < 46\), so \(46\) is an outlier.
(b) With \(46\): mean \(= \dfrac{120}{6} = 20\), median \(= \dfrac{15 + 16}{2} = 15.5\). Without: mean \(= \dfrac{74}{5} = 14.8\), median \(= 15\).
The outlier changes the mean a lot (\(20 \to 14.8\)) but the median only a little (\(15.5 \to 15\)).