14.7 Graphs of Sine and Cosine
SL 3.7
- what a periodic function is, and the words period, principal axis and amplitude
- the graph of \(y = \sin x\) and its key features
- the general sine function \(y = a\sin\big(b(x - c)\big) + d\), and what each of \(a\), \(b\), \(c\), \(d\) does
- the graph of \(y = \cos x\), and how the sine and cosine graphs are related
- the general cosine function \(y = a\cos\big(b(x - c)\big) + d\)
- how to find the equation of a sine or cosine graph from its picture
Periodic behaviour
Many things in the world repeat in a regular way. For example:
- the length of the day at one place changes through the year, and then the pattern starts again;
- the height of the sea in a harbour goes up and down with the tides;
- the average temperature of a city rises and falls with the seasons;
- the shape of the Moon that we see goes through the same phases every month.
Behaviour that repeats over time is called periodic (or cyclic, or oscillating). In this unit we use trigonometric functions to describe it.
A periodic function is a function whose graph repeats itself again and again in the horizontal direction. The period is the horizontal length of one complete repetition (one cycle).
Periodic function Not in the formula booklet
\[ f(x + p) = f(x) \quad \text{for all } x \]
and \(p\) is the smallest positive number for which this is true.
- \(f\): a periodic function
- \(p\): the period of \(f\)
Not every periodic graph is a wave. For example, take a point on the rim of a wheel. As the wheel rolls along a flat surface, the point traces out a curve called a cycloid. The same arch is made again on every turn of the wheel.
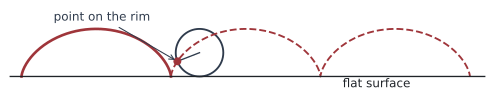
In this course we mostly study periodic functions with a smooth wave shape.
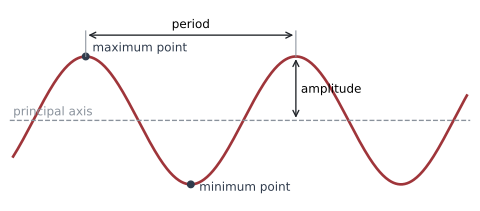
- A maximum point is at the top of a crest. A minimum point is at the bottom of a trough.
- The wave goes up and down about a horizontal line called the principal axis (or mean line). It is half-way between the maximum and the minimum.
- The amplitude is the vertical distance from the principal axis to a maximum (or to a minimum).
Principal axis and amplitude of a wave Not in the formula booklet
\[ \text{principal axis: } \; y = \frac{\max + \min}{2} \qquad \text{amplitude} = \frac{\max - \min}{2} \]
- \(\max\): the greatest value (the \(y\)-coordinate of a maximum point)
- \(\min\): the least value (the \(y\)-coordinate of a minimum point)
The amplitude is a distance, so it is never negative.
Example 1 Which of these graphs show periodic behaviour? Assume that each graph continues in the same way to the right.
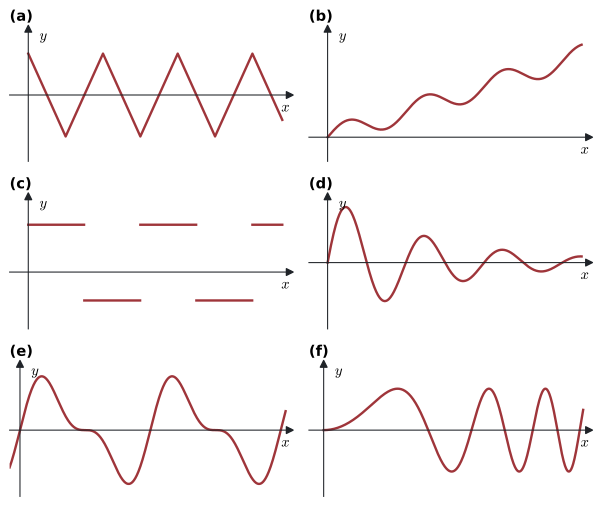
- (a) Periodic. The same “zig-zag” repeats.
- (b) Not periodic. The graph keeps rising, so no part is repeated exactly.
- (c) Periodic. The same pair of steps repeats (a “square wave”).
- (d) Not periodic. The waves get smaller and smaller, so the shape does not repeat.
- (e) Periodic. The same (unusual) wave shape repeats.
- (f) Not periodic. The waves get narrower and narrower.
A graph is periodic only if one piece can be copied and moved sideways to fit the next piece exactly.
The sine function
The basic sine curve
In Section 14.6, \(\sin\theta\) is the \(y\)-coordinate of a point on the unit circle. As the point goes once round the circle, we can plot its height against the angle \(x\) (in radians). This gives the graph of \(y = \sin x\).
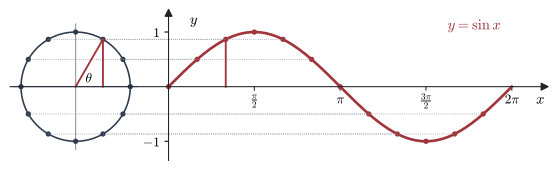
After one full turn (\(2\pi\) radians) the point is back where it started, so the graph repeats. The wave continues forever in both directions.
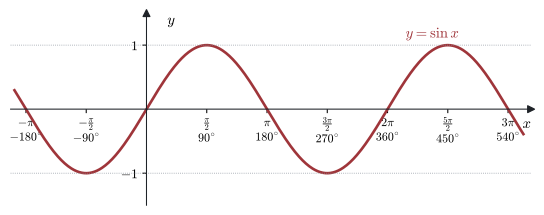
Key features of \(y = \sin x\) Not in the formula booklet
- domain \(x \in \mathbb{R}\); range \(-1 \le y \le 1\)
- period \(2\pi\); amplitude \(1\); principal axis \(y = 0\)
- zeros at \(x = k\pi\); maximum \(1\) at \(x = \frac{\pi}{2} + 2k\pi\); minimum \(-1\) at \(x = \frac{3\pi}{2} + 2k\pi\)
- \(k\): any integer (\(k \in \mathbb{Z}\))
It helps to remember the five key points of one cycle: \((0, 0)\), \(\left(\frac{\pi}{2}, 1\right)\), \((\pi, 0)\), \(\left(\frac{3\pi}{2}, -1\right)\), \((2\pi, 0)\). They are a quarter of a period apart.
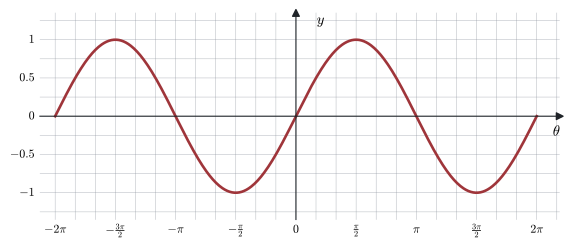
Example 2 The diagram shows the graph of \(y = \sin\theta\) for \(-2\pi \le \theta \le 2\pi\).
(a) Write down the \(y\)-intercept of the graph.
(b) Find the values of \(\theta\), for \(-2\pi \le \theta \le 2\pi\), for which
(i) \(\sin\theta = 0\)
(ii) \(\sin\theta = 1\)
(iii) \(\sin\theta = -\dfrac{1}{2}\).
(c) Find the intervals in \(-2\pi \le \theta \le 2\pi\) where \(\sin\theta\) is
\(\qquad\) (i) positive \(\qquad\) (ii) negative.
(d) Write down the range of the function.
(a) The graph passes through the origin, so the \(y\)-intercept is \(0\).
(b)
(i) The graph meets the \(\theta\)-axis at \(\theta = -2\pi,\; -\pi,\; 0,\; \pi,\; 2\pi\).
(ii) The maximum points are at \(\theta = -\dfrac{3\pi}{2}\) and \(\theta = \dfrac{\pi}{2}\).
(iii) We know \(\sin\dfrac{\pi}{6} = \dfrac{1}{2}\). The trough between \(\pi\) and \(2\pi\) is the crest between \(0\) and \(\pi\) turned upside down. So the graph reaches \(-\dfrac{1}{2}\) at \(\dfrac{\pi}{6}\) after \(\pi\) and at \(\dfrac{\pi}{6}\) before \(2\pi\):
\[ \theta = \pi + \frac{\pi}{6} = \frac{7\pi}{6}, \qquad \theta = 2\pi - \frac{\pi}{6} = \frac{11\pi}{6} . \]
The graph repeats every \(2\pi\), so subtract \(2\pi\) to get the other two: \(\theta = -\dfrac{5\pi}{6}\) and \(\theta = -\dfrac{\pi}{6}\). So \(\theta = -\dfrac{5\pi}{6},\; -\dfrac{\pi}{6},\; \dfrac{7\pi}{6},\; \dfrac{11\pi}{6}\).
(c)
(i) Positive (above the axis): \(-2\pi < \theta < -\pi\) and \(0 < \theta < \pi\).
(ii) Negative (below the axis): \(-\pi < \theta < 0\) and \(\pi < \theta < 2\pi\).
(d) The range is \(-1 \le y \le 1\).
The general sine function
The general sine function Not in the formula booklet
\[ y = a\sin\big(b(x - c)\big) + d, \qquad a \neq 0,\; b > 0 \]
- amplitude \(= |a|\)
- period \(= \dfrac{2\pi}{b}\)
- principal axis: \(y = d\)
- maximum value \(d + |a|\); minimum value \(d - |a|\)
- \(a\): changes the amplitude (a vertical stretch with scale factor \(a\); if \(a < 0\) the graph is also reflected)
- \(b\): changes the period (a horizontal stretch with scale factor \(\frac{1}{b}\)); \(b\) is the number of cycles in an interval of length \(2\pi\)
- \(c\): the horizontal translation (\(c > 0\): right; \(c < 0\): left)
- \(d\): the vertical translation (\(d > 0\): up; \(d < 0\): down)
These are the transformations of Unit 12, applied to \(y = \sin x\). For example, \(y = 3\sin 2x\) comes from \(y = \sin x\) by a vertical stretch with scale factor \(3\) and a horizontal stretch with scale factor \(\frac{1}{2}\).
Some books call \(b\) the frequency. (In physics, the frequency usually means \(\frac{1}{\text{period}}\), so always check what a question means.)
The IB syllabus writes the function as \(y = a\sin\big(b(x + c)\big) + d\). Then \(+c\) means a translation \(c\) units to the left. Both forms describe the same graphs.
Always factorise \(b\) out of the bracket before you read off the horizontal shift:
\[ \sin(2x - \pi) = \sin\left(2\left(x - \frac{\pi}{2}\right)\right) \]
so the shift is \(\frac{\pi}{2}\) to the right, not \(\pi\).
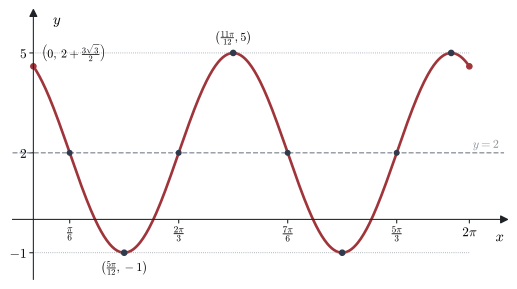
Example 3 For the function \(y = -3\sin\left(2x - \dfrac{\pi}{3}\right) + 2\),
(a) state the amplitude, the period, the horizontal translation and the vertical translation;
(b) sketch the graph for \(0 \le x \le 2\pi\).
(a) Factorise the bracket: \(\;2x - \dfrac{\pi}{3} = 2\left(x - \dfrac{\pi}{6}\right)\). So \(a = -3\), \(b = 2\), \(c = \dfrac{\pi}{6}\), \(d = 2\).
- amplitude \(= |-3| = 3\)
- period \(= \dfrac{2\pi}{2} = \pi\) (so \(b = 2\) cycles in every \(2\pi\))
- horizontal translation: \(\dfrac{\pi}{6}\) to the right
- vertical translation: \(2\) up; the principal axis is \(y = 2\)
Because \(a < 0\), the graph is also reflected: it goes down first from the principal axis.
(b) The maximum is \(2 + 3 = 5\) and the minimum is \(2 - 3 = -1\). One cycle starts on the principal axis at \(x = \dfrac{\pi}{6}\). A quarter of the period is \(\dfrac{\pi}{4}\), so the key points are
| \(x\) | \(\frac{\pi}{6}\) | \(\frac{5\pi}{12}\) | \(\frac{2\pi}{3}\) | \(\frac{11\pi}{12}\) | \(\frac{7\pi}{6}\) |
|---|---|---|---|---|---|
| \(y\) | \(2\) | \(-1\) (min) | \(2\) | \(5\) (max) | \(2\) |
The next cycle adds \(\pi\) to each \(x\)-value: minimum at \(\dfrac{17\pi}{12}\), maximum at \(\dfrac{23\pi}{12}\). At \(x = 0\): \(\;y = -3\sin\left(-\dfrac{\pi}{3}\right) + 2 = \dfrac{3\sqrt{3}}{2} + 2 \approx 4.60\), and the value at \(x = 2\pi\) is the same.
Example 4 The graph of \(y = m\sin x + n\) is shown. It has a minimum point at \(\left(\frac{\pi}{2}, -2\right)\) and a maximum point at \(\left(\frac{3\pi}{2}, 4\right)\). Find \(m\) and \(n\).
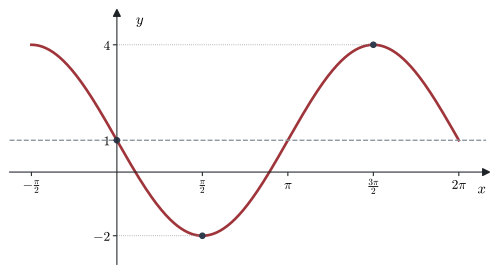
The principal axis is half-way between the maximum and the minimum:
\[ n = \frac{4 + (-2)}{2} = 1 . \]
The amplitude is \(\dfrac{4 - (-2)}{2} = 3\), so \(m = 3\) or \(m = -3\).
At \(x = \dfrac{\pi}{2}\), \(\sin x = 1\), but the graph has a minimum there. So \(m\) is negative. Check: \(m(1) + 1 = -2\) gives \(m = -3\).
So \(m = -3\) and \(n = 1\), that is, \(y = -3\sin x + 1\).
The cosine function
The basic cosine curve
\(\cos\theta\) is the \(x\)-coordinate of the point on the unit circle. If we plot it against the angle, we get the graph of \(y = \cos x\). It starts at its maximum, \((0, 1)\), because the point starts at \((1, 0)\) on the circle.
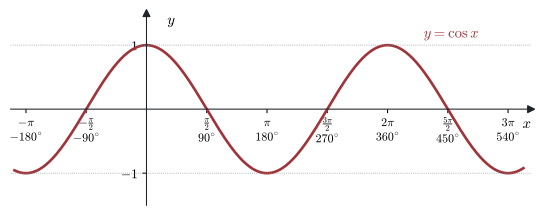
Key features of \(y = \cos x\) Not in the formula booklet
- domain \(x \in \mathbb{R}\); range \(-1 \le y \le 1\)
- period \(2\pi\); amplitude \(1\); principal axis \(y = 0\)
- zeros at \(x = \frac{\pi}{2} + k\pi\); maximum \(1\) at \(x = 2k\pi\); minimum \(-1\) at \(x = \pi + 2k\pi\)
- \(k\): any integer (\(k \in \mathbb{Z}\))
The five key points of one cycle are \((0, 1)\), \(\left(\frac{\pi}{2}, 0\right)\), \((\pi, -1)\), \(\left(\frac{3\pi}{2}, 0\right)\), \((2\pi, 1)\). The graph is symmetric about the \(y\)-axis, because \(\cos(-x) = \cos x\).
Relationship between the sine and cosine functions
The two graphs have exactly the same shape. The cosine graph is the sine graph translated \(\frac{\pi}{2}\) units to the left.
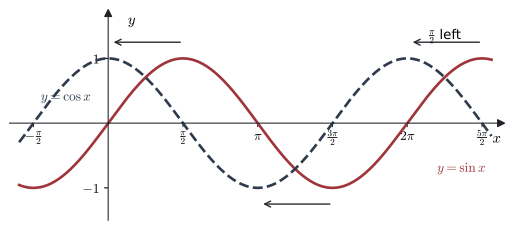
Sine and cosine as translations of each other Not in the formula booklet
\[ \cos x = \sin\left(x + \frac{\pi}{2}\right) \qquad \sin x = \cos\left(x - \frac{\pi}{2}\right) \]
- \(x\): any real number (an angle in radians)
So every sine wave can also be written as a cosine wave, and the other way round.
The general cosine function
The general cosine function Not in the formula booklet
\[ y = a\cos\big(b(x - c)\big) + d, \qquad a \neq 0,\; b > 0 \]
amplitude \(= |a|\), \(\;\) period \(= \dfrac{2\pi}{b}\), \(\;\) principal axis \(y = d\).
- \(a\): vertical stretch (amplitude \(|a|\))
- \(b\): horizontal stretch with scale factor \(\frac{1}{b}\)
- \(c\): horizontal translation; \(d\): vertical translation
The numbers \(a\), \(b\), \(c\), \(d\) do exactly the same jobs as in the sine function. For \(a > 0\), a cosine wave starts its cycle at a maximum (at \(x = c\)); a sine wave starts on the principal axis, going up.
Example 5 State the amplitude, the period, the horizontal translation and the vertical translation of \(y = 4\cos\left(2x + \dfrac{\pi}{3}\right) - 1\). Write down the range of the function.
Factorise: \(\;2x + \dfrac{\pi}{3} = 2\left(x + \dfrac{\pi}{6}\right) = 2\left(x - \left(-\dfrac{\pi}{6}\right)\right)\). So \(a = 4\), \(b = 2\), \(c = -\dfrac{\pi}{6}\), \(d = -1\).
- amplitude \(= 4\)
- period \(= \dfrac{2\pi}{2} = \pi\)
- horizontal translation: \(\dfrac{\pi}{6}\) to the left
- vertical translation: \(1\) down (principal axis \(y = -1\))
The range is \(-1 - 4 \le y \le -1 + 4\), that is, \(-5 \le y \le 3\).
Example 6 For each graph, find an equation in two forms:
(i) as a transformation of \(f(x) = \sin x\), that is, \(y = a\sin\big(b(x - c)\big) + d\);
(ii) as a transformation of \(f(x) = \cos x\), that is, \(y = a\cos\big(b(x - c)\big) + d\).
(a)
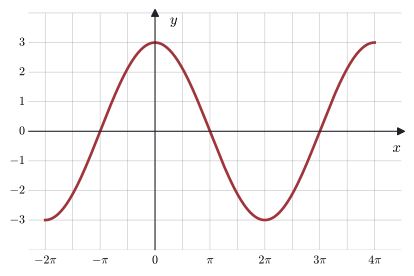
(b)
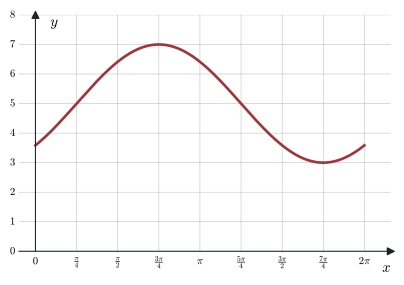
(c)
(d)
Method: read the maximum and minimum to get \(d\) and \(|a|\); read the distance between two maxima to get the period, then \(b = \dfrac{2\pi}{\text{period}}\). For the cosine form, put \(c\) at a maximum. For the sine form, put \(c\) where the graph crosses the principal axis going up.
(a) Maximum \(3\), minimum \(-3\): \(d = 0\), \(a = 3\). Maxima at \(x = 0\) and \(x = 4\pi\), so the period is \(4\pi\) and \(b = \dfrac{2\pi}{4\pi} = \dfrac{1}{2}\).
(i) The graph crosses \(y = 0\) going up at \(x = -\pi\): \(\;y = 3\sin\left(\dfrac{1}{2}(x + \pi)\right)\).
(ii) A maximum is at \(x = 0\): \(\;y = 3\cos\left(\dfrac{x}{2}\right)\).
(b) Maximum \(7\), minimum \(3\): \(d = 5\), \(a = 2\). The maximum is at \(\frac{3\pi}{4}\) and the next minimum at \(\frac{7\pi}{4}\); half a period is \(\pi\), so the period is \(2\pi\) and \(b = 1\).
(i) It crosses \(y = 5\) going up at \(x = \dfrac{\pi}{4}\): \(\;y = 2\sin\left(x - \dfrac{\pi}{4}\right) + 5\).
(ii) A maximum is at \(x = \dfrac{3\pi}{4}\): \(\;y = 2\cos\left(x - \dfrac{3\pi}{4}\right) + 5\).
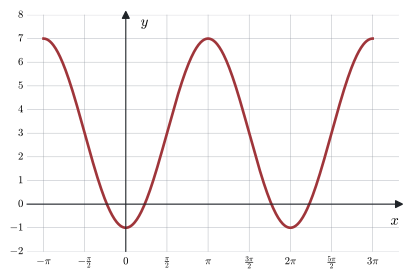
(c) Maximum \(7\), minimum \(-1\): \(d = 3\), \(a = 4\). Maxima at \(x = -\pi\) and \(x = \pi\), so the period is \(2\pi\) and \(b = 1\).
(i) It crosses \(y = 3\) going up at \(x = \dfrac{\pi}{2}\): \(\;y = 4\sin\left(x - \dfrac{\pi}{2}\right) + 3\).
(ii) A maximum is at \(x = \pi\): \(\;y = 4\cos(x - \pi) + 3\). (This is the same as \(y = -4\cos x + 3\).)
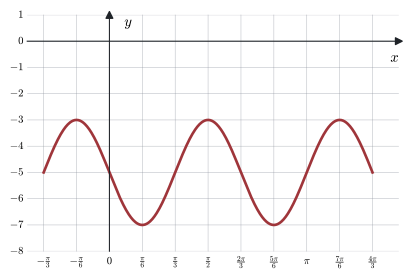
(d) Maximum \(-3\), minimum \(-7\): \(d = -5\), \(a = 2\). Maxima at \(x = -\dfrac{\pi}{6}\) and \(x = \dfrac{\pi}{2}\), so the period is \(\dfrac{2\pi}{3}\) and \(b = 3\).
(i) It crosses \(y = -5\) going up at \(x = \dfrac{\pi}{3}\): \(\;y = 2\sin\left(3\left(x - \dfrac{\pi}{3}\right)\right) - 5\).
(ii) A maximum is at \(x = -\dfrac{\pi}{6}\): \(\;y = 2\cos\left(3\left(x + \dfrac{\pi}{6}\right)\right) - 5\).
These answers are not the only ones. Any value of \(c\) that differs by a whole number of periods gives the same graph, and a negative \(a\) can also be used. For example, (d) is also \(y = -2\sin 3x - 5\).
- Check that the screen shows RAD at the top right. If it shows DEG, click on it to switch.
- Add a Graphs page.
- Enter \(f_1(x) = 2\sin\big(3(x - \frac{\pi}{3})\big) - 5\) and press enter.
- Enter \(f_2(x) = 2\cos\big(3(x + \frac{\pi}{6})\big) - 5\) and press enter.
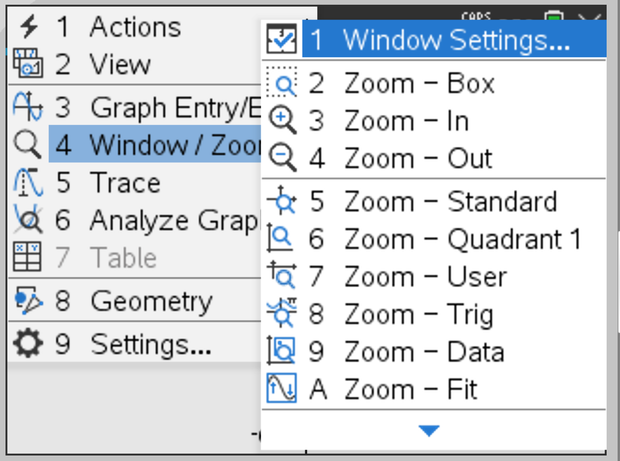
- Use Menu → Window / Zoom → Zoom – Trig to get a good window.
- If only one curve can be seen, the two graphs lie exactly on top of each other: the forms are equivalent.
- For a second check, press ctrl + T (split-screen table) and compare the values of \(f_1\) and \(f_2\).
Common errors
| ✗ Wrong | ✓ Right | Why |
|---|---|---|
| The period of \(y = \sin 2x\) is \(4\pi\) | The period is \(\frac{2\pi}{2} = \pi\) | \(b = 2\) squeezes the graph: two cycles fit in \(2\pi\). |
| \(y = \sin\left(2x - \frac{\pi}{3}\right)\) is shifted \(\frac{\pi}{3}\) right | It is shifted \(\frac{\pi}{6}\) right | Factorise first: \(2\left(x - \frac{\pi}{6}\right)\). |
| The amplitude of \(y = -3\sin x\) is \(-3\) | The amplitude is \(3\) | The amplitude is a distance: \(|a|\). |
| Amplitude \(= \max - \min\) | Amplitude \(= \frac{\max - \min}{2}\) | \(\max - \min\) is the full height of the wave, which is twice the amplitude. |
| The principal axis is always the \(x\)-axis | It is \(y = d = \frac{\max + \min}{2}\) | A vertical translation moves the principal axis. |
| Using degree mode for \(\sin\left(\frac{\pi}{6}\right)\) | Use radian mode | \(\pi\) means radians. In degree mode the calculator gives a wrong value. |
Exercises
1 A wave has maximum value \(9\) and minimum value \(1\). Two consecutive maximum points are at \(x = 2\) and \(x = 8\). Write down the equation of the principal axis, the amplitude and the period.
Principal axis \(y = \dfrac{9 + 1}{2} = 5\). Amplitude \(= \dfrac{9 - 1}{2} = 4\). Period \(= 8 - 2 = 6\).
2 A function \(f\) is periodic with period \(5\), and \(f(2) = 3\). Find \(f(17)\) and \(f(-8)\).
\(17 = 2 + 3 \times 5\), so \(f(17) = f(2) = 3\).
\(-8 = 2 - 2 \times 5\), so \(f(-8) = f(2) = 3\).
3 Use the graph of \(y = \cos x\) for \(0 \le x \le 2\pi\).
(a) Find the values of \(x\) for which \(\cos x = 0\).
(b) Find the value of \(x\) for which \(\cos x = -1\).
(c) Find the interval where \(\cos x < 0\).
(a) \(x = \dfrac{\pi}{2}\) and \(x = \dfrac{3\pi}{2}\).
(b) \(x = \pi\).
(c) \(\dfrac{\pi}{2} < x < \dfrac{3\pi}{2}\).
4 For \(y = 5\sin 4x - 2\), state the amplitude, the period, the principal axis, and the maximum and minimum values.
Amplitude \(5\). Period \(\dfrac{2\pi}{4} = \dfrac{\pi}{2}\). Principal axis \(y = -2\). Maximum \(-2 + 5 = 3\); minimum \(-2 - 5 = -7\).
5 For \(y = -2\cos\left(\dfrac{x}{3}\right) + 4\), state the amplitude and the period, and write down the range.
Amplitude \(|-2| = 2\). Here \(b = \dfrac{1}{3}\), so the period is \(2\pi \div \dfrac{1}{3} = 6\pi\). Range: \(4 - 2 \le y \le 4 + 2\), that is, \(2 \le y \le 6\).
6 The graph of \(y = 3\sin\left(2x + \dfrac{\pi}{2}\right) - 1\) is obtained from the graph of \(y = \sin x\) by a sequence of transformations.
(a) Write the equation in the form \(y = a\sin\big(b(x - c)\big) + d\).
(b) Describe the transformations.
(a) \(2x + \dfrac{\pi}{2} = 2\left(x + \dfrac{\pi}{4}\right)\), so \(y = 3\sin\left(2\left(x + \dfrac{\pi}{4}\right)\right) - 1\).
(b) A horizontal stretch with scale factor \(\dfrac{1}{2}\), a vertical stretch with scale factor \(3\), then a translation \(\dfrac{\pi}{4}\) to the left and \(1\) down, that is, by the vector \(\begin{pmatrix} -\frac{\pi}{4} \\ -1 \end{pmatrix}\).
7 Sketch \(y = 2\cos\left(x - \dfrac{\pi}{3}\right)\) for \(0 \le x \le 2\pi\). Give the \(y\)-intercept, the \(x\)-intercepts, and the coordinates of the maximum and minimum points.
This is \(y = 2\cos x\) translated \(\dfrac{\pi}{3}\) to the right.
- \(y\)-intercept: \(2\cos\left(-\dfrac{\pi}{3}\right) = 2 \times \dfrac{1}{2} = 1\), so \((0, 1)\).
- Maximum where \(x - \dfrac{\pi}{3} = 0\): \(\left(\dfrac{\pi}{3}, 2\right)\). Minimum where \(x - \dfrac{\pi}{3} = \pi\): \(\left(\dfrac{4\pi}{3}, -2\right)\).
- \(x\)-intercepts where \(x - \dfrac{\pi}{3} = \dfrac{\pi}{2}\) or \(\dfrac{3\pi}{2}\): \(x = \dfrac{5\pi}{6}\) and \(x = \dfrac{11\pi}{6}\).
- At \(x = 2\pi\): \(y = 2\cos\dfrac{5\pi}{3} = 1\).
The curve rises from \((0, 1)\) to the maximum, falls through \(\frac{5\pi}{6}\) to the minimum, and rises through \(\frac{11\pi}{6}\) to \((2\pi, 1)\).
8 The graph shows \(y = a\sin(bx) + d\), where \(a > 0\) and \(b > 0\). Find \(a\), \(b\) and \(d\).
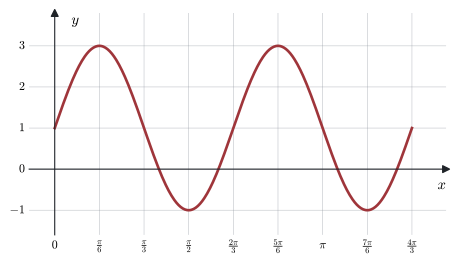
Maximum \(3\), minimum \(-1\): \(d = \dfrac{3 + (-1)}{2} = 1\) and \(a = \dfrac{3 - (-1)}{2} = 2\).
Maxima at \(x = \dfrac{\pi}{6}\) and \(x = \dfrac{5\pi}{6}\), so the period is \(\dfrac{2\pi}{3}\) and \(b = 2\pi \div \dfrac{2\pi}{3} = 3\).
\(y = 2\sin 3x + 1\).
9 Write \(y = 4\sin\left(x + \dfrac{\pi}{6}\right)\) in the form \(y = 4\cos(x - c)\), where \(0 < c < \pi\).
Use \(\sin\theta = \cos\left(\theta - \dfrac{\pi}{2}\right)\) with \(\theta = x + \dfrac{\pi}{6}\):
\[ 4\sin\left(x + \frac{\pi}{6}\right) = 4\cos\left(x + \frac{\pi}{6} - \frac{\pi}{2}\right) = 4\cos\left(x - \frac{\pi}{3}\right). \]
So \(c = \dfrac{\pi}{3}\).
10 The function \(f(x) = a\sin\big(b(x - c)\big) + d\), with \(a > 0\) and \(b > 0\), has a maximum point at \(\left(\dfrac{\pi}{4}, 6\right)\). The next minimum point is \(\left(\dfrac{\pi}{2}, -2\right)\).
(a) Find \(a\), \(b\) and \(d\).
(b) Find the smallest positive value of \(c\).
(a) \(a = \dfrac{6 - (-2)}{2} = 4\) and \(d = \dfrac{6 + (-2)}{2} = 2\). From a maximum to the next minimum is half a period: \(\dfrac{\pi}{2} - \dfrac{\pi}{4} = \dfrac{\pi}{4}\). So the period is \(\dfrac{\pi}{2}\) and \(b = 2\pi \div \dfrac{\pi}{2} = 4\).
(b) A sine wave (with \(a > 0\)) reaches its maximum a quarter of a period after \(x = c\). A quarter period is \(\dfrac{\pi}{8}\), so \(c = \dfrac{\pi}{4} - \dfrac{\pi}{8} = \dfrac{\pi}{8}\).
Check: \(f\left(\dfrac{\pi}{4}\right) = 4\sin\left(4 \times \dfrac{\pi}{8}\right) + 2 = 4\sin\dfrac{\pi}{2} + 2 = 6\). ✓