25.4 The Graph of the Derivative
SL 5.7
- how the graphs of \(f\), \(f'\) and \(f''\) are connected
- how to sketch the graph of \(y = f'(x)\) from the graph of \(y = f(x)\), including asymptotes
- how to sketch a possible graph of \(y = f(x)\) from the graph of \(y = f'(x)\)
- how to sketch \(y = f(x)\) from the sign diagrams of \(f'(x)\) and \(f''(x)\)
Reading \(f'\) and \(f''\) from the graph of \(f\)
The ideas of 25.2 and 25.3 give a dictionary between the graphs.
The graphs of \(f\), \(f'\) and \(f''\) Not in the formula booklet
- The sign of \(f'(x)\) tells us where \(f\) is increasing (\(f' > 0\)) or decreasing (\(f' < 0\)).
- The zeros of \(f'(x)\) give the stationary points of \(f\).
- The sign of \(f''(x)\) tells us the concavity of \(f\).
- The zeros of \(f''(x)\) give points of inflexion of \(f\), provided \(f''\) changes sign there.
So, when we go from the graph of \(f\) to the graph of \(f'\): Not in the formula booklet
| On the graph of \(y = f(x)\) | On the graph of \(y = f'(x)\) |
|---|---|
| increasing | above the \(x\)-axis |
| decreasing | below the \(x\)-axis |
| stationary point (max, min or stationary inflexion) | meets the \(x\)-axis |
| point of inflexion | local max or min (a turning point) |
| concave up (\(f'' > 0\)) | \(f'\) is increasing |
| concave down (\(f'' < 0\)) | \(f'\) is decreasing |
| vertical asymptote \(x = a\) | (usually) vertical asymptote \(x = a\) |
| horizontal asymptote \(y = c\) | \(f'(x) \to 0\): horizontal asymptote \(y = 0\) |
| oblique asymptote \(y = mx + c\) | \(f'(x) \to m\): horizontal asymptote \(y = m\) |
A good method is to go along the graph of \(f\) from left to right and ask at each part: “Is the gradient positive or negative? Is it getting steeper or flatter?”
Example 1 The diagram shows the graph of \(y = f(x)\). The curve has a stationary point at \((0, 0)\), and its asymptotes are \(x = -3\), \(x = 3\) and \(y = 1\). Sketch the graph of \(y = f'(x)\).
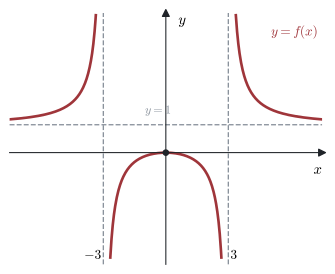
Go from left to right:
- \(x < -3\): \(f\) increases, slowly at first and then very steeply. So \(f'(x) > 0\), close to \(0\) for large negative \(x\), and \(f'(x) \to +\infty\) as \(x \to -3\).
- \(-3 < x < 0\): \(f\) increases, from very steep to flat at \((0, 0)\). So \(f'(x)\) comes down from \(+\infty\) to \(0\).
- \(0 < x < 3\): \(f\) decreases, getting steeper. So \(f'(x)\) goes from \(0\) down to \(-\infty\).
- \(x > 3\): \(f\) decreases, getting flatter. So \(f'(x) < 0\) and \(f'(x) \to 0\).
The graph of \(f'\) has vertical asymptotes \(x = \pm 3\), a horizontal asymptote \(y = 0\), and passes through \((0, 0)\).
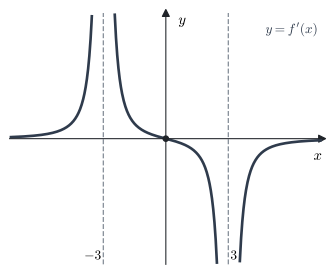
(This curve is \(f(x) = \frac{x^2}{x^2 - 9}\), with \(f'(x) = -\frac{18x}{(x^2 - 9)^2}\).)
Example 2 The diagram shows the graph of \(y = f(x)\). The curve has a local minimum at \(A(2, 5)\) and a local maximum at \(B(0, 1)\). The asymptotes are \(x = 1\) and \(y = x + 2\).
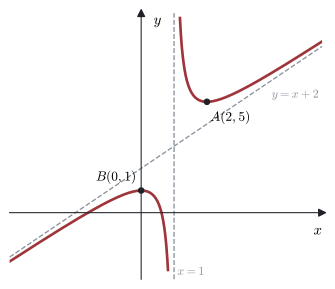
Sketch the graph of \(y = f'(x)\). Show the asymptotes and the points that correspond to \(A\) and \(B\).
- Stationary points \(A\) and \(B\) become the zeros of \(f'\): the points \((2, 0)\) and \((0, 0)\).
- The oblique asymptote \(y = x + 2\) has gradient \(1\), so far from the origin the gradient of \(f\) is close to \(1\): \(f'\) has the horizontal asymptote \(y = 1\).
- Near \(x = 1\), the graph of \(f\) goes down steeply on both sides, so \(f'(x) \to -\infty\) on both sides of \(x = 1\).
- \(x < 0\): \(f\) increases, but less steeply than the asymptote, so \(0 < f'(x) < 1\). \(0 < x < 1\) and \(1 < x < 2\): \(f\) decreases, so \(f'(x) < 0\). \(x > 2\): \(f\) increases, so \(0 < f'(x) < 1\).
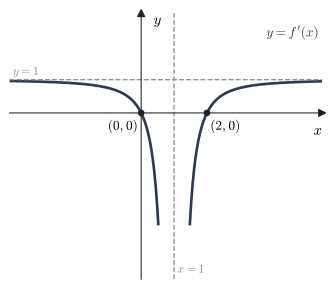
(This curve is \(f(x) = x + 2 + \frac{1}{x - 1}\), with \(f'(x) = 1 - \frac{1}{(x - 1)^2}\).)
Sketching \(f\) from the graph of \(f'\)
Now go the other way. Read the sign of \(f'\) to see where \(f\) goes up or down, and the turning points of \(f'\) to find the points of inflexion of \(f\). The graph of \(f'\) does not tell us the height of \(f\), so there are many possible answers (each one is a vertical translation of the others).
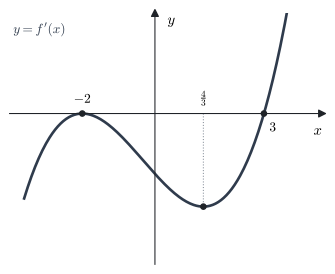
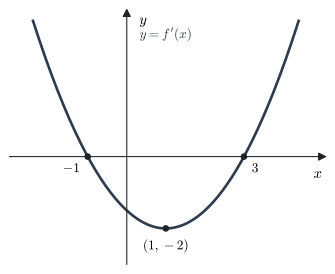
Example 3 For each graph of \(y = f'(x)\) below, sketch a graph which could be \(y = f(x)\). Show clearly the \(x\)-coordinates of any stationary points and points of inflexion.
(a)
(b)
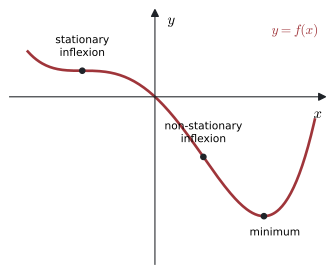
(a) \(f'(x) \le 0\) for \(x < 3\) and \(f'(x) > 0\) for \(x > 3\).
- At \(x = -2\), \(f'\) touches the axis: \(f'\) is negative on both sides. So \(f\) has a stationary point of inflexion at \(x = -2\).
- At \(x = 3\), \(f'\) changes from \(-\) to \(+\): a local minimum at \(x = 3\).
- \(f'\) has turning points at \(x = -2\) and \(x = \frac{4}{3}\), so \(f\) has points of inflexion there. The one at \(x = \frac{4}{3}\) is non-stationary.
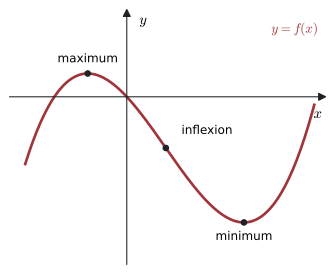
(b) \(f'\) changes from \(+\) to \(-\) at \(x = -1\) (local maximum of \(f\)) and from \(-\) to \(+\) at \(x = 3\) (local minimum of \(f\)). The vertex of \(f'\) at \(x = 1\) is a point of inflexion of \(f\) (non-stationary, since \(f'(1) = -2\)). \(f\) is a cubic shape: concave down for \(x < 1\), concave up for \(x > 1\).
Sketching \(f\) from sign diagrams
Example 4 For a function \(g\), the sign diagrams of \(g'(x)\) and \(g''(x)\) are:
| \(x\) | \(x < 0\) | \(0\) | \(0 < x < 3\) | \(3\) | \(x > 3\) |
|---|---|---|---|---|---|
| \(g'(x)\) | \(+\) | \(0\) | \(+\) | \(0\) | \(-\) |
| \(x\) | \(x < 0\) | \(0\) | \(0 < x < 2\) | \(2\) | \(x > 2\) |
|---|---|---|---|---|---|
| \(g''(x)\) | \(-\) | \(0\) | \(+\) | \(0\) | \(-\) |
The points \(A(0, 0)\), \(B(2, 4)\) and \(C\left(3, \frac{27}{4}\right)\) lie on \(y = g(x)\). Sketch \(y = g(x)\), labelling the stationary points.
- \(g' = 0\) at \(x = 0\), with \(+\) on both sides: \(A(0, 0)\) is a stationary inflexion. (Also \(g''\) changes sign there.)
- \(g'\) changes from \(+\) to \(-\) at \(x = 3\): \(C\left(3, \frac{27}{4}\right)\) is a local maximum.
- \(g''\) changes sign at \(x = 2\) and \(g'(2) > 0\): \(B(2, 4)\) is a non-stationary inflexion.
- Concave down for \(x < 0\), concave up for \(0 < x < 2\), concave down for \(x > 2\).
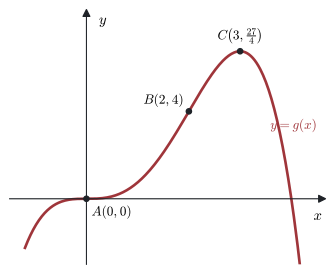
(One function with these properties is \(g(x) = x^3 - \frac{1}{4}x^4\).)
Common errors
| ✗ Wrong | ✓ Right | Why |
|---|---|---|
| Drawing \(f'\) with the same shape as \(f\) | Draw the gradient of \(f\) | A maximum of \(f\) is a zero of \(f'\), not a maximum of \(f'\). |
| Stationary points of \(f\) placed at turning points of \(f'\) | Stationary points of \(f\) are zeros of \(f'\) | Turning points of \(f'\) are inflexion points of \(f\). |
| Horizontal asymptote \(y = c\) of \(f\) copied as \(y = c\) for \(f'\) | It becomes \(y = 0\) | The gradient of a curve that flattens out tends to \(0\). |
| Oblique asymptote \(y = mx + c\) ignored | \(f'\) tends to \(m\) | The curve becomes parallel to a line of gradient \(m\). |
| \(f'\) touching the axis read as a max or min of \(f\) | It is a stationary inflexion | The sign of \(f'\) does not change. |
Exercises
1 The function \(f\) is a quadratic with a minimum point at \((2, -1)\). Describe the graph of \(y = f'(x)\).
The derivative of a quadratic is linear. \(f'(2) = 0\), \(f'(x) < 0\) for \(x < 2\) and \(f'(x) > 0\) for \(x > 2\). So \(y = f'(x)\) is a straight line with positive gradient that crosses the \(x\)-axis at \((2, 0)\).
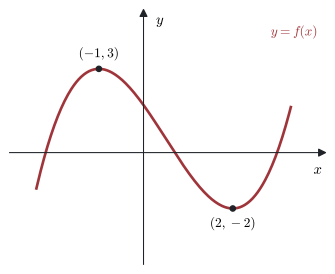
2 The diagram shows the graph of a cubic \(y = f(x)\) with a local maximum at \((-1, 3)\) and a local minimum at \((2, -2)\).
(a) State the values of \(x\) for which \(f\) is
(i) increasing,
(ii) decreasing.
(b) The point of inflexion of a cubic is halfway between its turning points. State the values of \(x\) for which \(f\) is
(i) concave up,
(ii) concave down.
(c) Sketch the graph of \(y = f'(x)\).
(a) (i) \(x < -1\) or \(x > 2\). \(\quad\) (ii) \(-1 < x < 2\).
(b) Inflexion at \(x = \frac{-1 + 2}{2} = \frac{1}{2}\).
(i) \(x > \frac{1}{2}\).
(ii) \(x < \frac{1}{2}\).
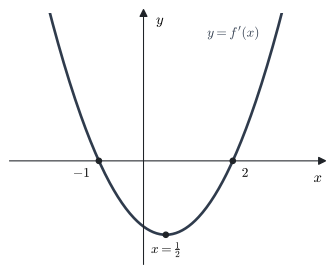
(c) A “U”-shaped parabola: a quadratic with zeros at \(x = -1\) and \(x = 2\) and its minimum at \(x = \frac{1}{2}\).
3 The graph of \(y = f(x)\) for \(0 \le x \le 5\) consists of two line segments: from \((0, 3)\) to \((2, 1)\), and from \((2, 1)\) to \((5, 7)\). Describe the graph of \(y = f'(x)\).
Gradient of the first segment: \(\frac{1 - 3}{2 - 0} = -1\). Gradient of the second: \(\frac{7 - 1}{5 - 2} = 2\).
So \(f'(x) = -1\) for \(0 < x < 2\) and \(f'(x) = 2\) for \(2 < x < 5\): two horizontal line segments. \(f'(2)\) does not exist (the graph of \(f\) has a corner there), so draw open circles at \(x = 2\).
4 Let \(f(x) = x + \dfrac{4}{x}\). Find \(f'(x)\). Write down the equations of the asymptotes of the graph of \(y = f'(x)\), and the points where it meets the \(x\)-axis.
\(f'(x) = 1 - \frac{4}{x^2}\).
Asymptotes of \(y = f'(x)\): \(x = 0\) (vertical) and \(y = 1\) (horizontal; this matches the oblique asymptote \(y = x\) of \(f\)).
\(f'(x) = 0\) when \(x^2 = 4\): the points \((-2, 0)\) and \((2, 0)\) (the stationary points of \(f\)).
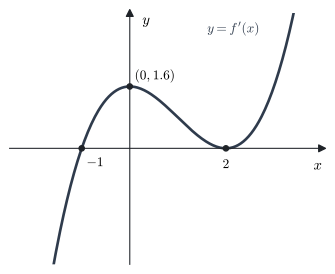
5 The diagram shows the graph of \(y = f'(x)\). It meets the \(x\)-axis at \(x = -1\) and touches it at \(x = 2\), and it has a local maximum at \((0, 1.6)\).
Find the \(x\)-coordinates of the stationary points of \(f\) and of the points of inflexion of \(f\). Classify each one.
- \(x = -1\): \(f'\) changes from \(-\) to \(+\): local minimum of \(f\).
- \(x = 2\): \(f'\) touches the axis and is \(+\) on both sides: stationary point of inflexion of \(f\).
- \(f'\) has turning points at \(x = 0\) and \(x = 2\), so \(f\) has points of inflexion at \(x = 0\) (non-stationary, since \(f'(0) = 1.6 \neq 0\)) and at \(x = 2\) (stationary).
6 The sign diagram of \(f'(x)\) is: \(-\) for \(x < -3\), \(+\) for \(-3 < x < 1\), \(+\) for \(1 < x < 5\), \(-\) for \(x > 5\), with \(f'(-3) = f'(1) = f'(5) = 0\). State the nature of each stationary point of \(f\).
\(x = -3\): \(-\) to \(+\), local minimum. \(\quad\) \(x = 1\): \(+\) to \(+\), stationary inflexion. \(\quad\) \(x = 5\): \(+\) to \(-\), local maximum.
7 For a function \(g\): \(g'(x) > 0\) for \(x < -1\) and \(x > 1\), \(g'(x) < 0\) for \(-1 < x < 1\); \(g''(x) < 0\) for \(x < 0\) and \(g''(x) > 0\) for \(x > 0\). The points \((-1, 4)\), \((0, 2)\) and \((1, 0)\) lie on the graph. Sketch \(y = g(x)\) and label the stationary points.
\((-1, 4)\) is a local maximum (\(+\) to \(-\)), \((1, 0)\) is a local minimum (\(-\) to \(+\)), and \((0, 2)\) is a non-stationary point of inflexion (concave down to concave up).
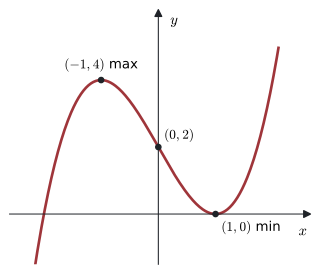
(For example \(g(x) = x^3 - 3x + 2\).)
8 The derivative of a function is \(f'(x) = x^2 - 4\). Find the \(x\)-coordinates of the local maximum, the local minimum and the point of inflexion of \(f\).
\(f'(x) = (x - 2)(x + 2)\): \(+\), \(-\), \(+\). Local maximum at \(x = -2\), local minimum at \(x = 2\).
\(f''(x) = 2x\), which is \(0\) and changes sign at \(x = 0\): point of inflexion at \(x = 0\).
9 Let \(f(x) = \ln(x^2 + 1)\). Find \(f'(x)\) and sketch the graph of \(y = f'(x)\), showing its turning points and asymptote. Hence state the \(x\)-coordinates of the points of inflexion of \(f\).
\(f'(x) = \frac{2x}{x^2 + 1}\). \(\quad\) \(f''(x) = \frac{2(x^2 + 1) - 2x(2x)}{(x^2 + 1)^2} = \frac{2(1 - x^2)}{(x^2 + 1)^2}\).
Turning points of \(f'\) at \(x = \pm 1\): \((1, 1)\) and \((-1, -1)\). As \(x \to \pm\infty\), \(f'(x) \to 0\): asymptote \(y = 0\).
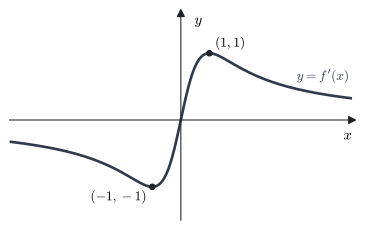
The points of inflexion of \(f\) are at \(x = -1\) and \(x = 1\) (where \(f'\) has turning points and \(f''\) changes sign).
10 The graph of \(y = f'(x)\) is a parabola that opens downwards and crosses the \(x\)-axis at \(x = 1\) and \(x = 5\). Which of these statements are true? Give a reason for each.
(a) \(f\) has a local maximum at \(x = 1\).
(b) \(f\) is increasing for \(1 < x < 5\).
(c) \(f\) has a point of inflexion at \(x = 3\).
(d) \(f\) is concave up for \(x > 3\).
The sign of \(f'\) is \(-\), \(+\), \(-\).
(a) False: \(f'\) goes from \(-\) to \(+\) at \(x = 1\), so it is a local minimum.
(b) True: \(f'(x) > 0\) for \(1 < x < 5\).
(c) True: \(f'\) has its maximum (vertex) at \(x = 3\), so \(f''\) changes from \(+\) to \(-\) there.
(d) False: for \(x > 3\), \(f'\) is decreasing, so \(f''(x) < 0\) and \(f\) is concave down.