14.10 Modelling Periodic Behaviour
SL 3.7
- what a sinusoidal model is, and which real situations it fits
- how to find \(a\), \(b\), \(c\) and \(d\) in \(y = a\sin\big(b(t - c)\big) + d\) from the maximum, the minimum and the period
- how to build a model from a table of data
- how to use a given model to answer questions about heights, lengths and times
Sinusoidal functions
The graphs of \(y = \sin x\) and \(y = \cos x\) have the same wave shape. We call both of them sinusoidal functions. Many things in the real world go up and down in a regular cycle, so we can describe them with a sinusoidal function:
- the height of the tide in a harbour
- the height of a seat on a Ferris wheel
- the length of a spring with a weight that moves up and down
- the number of hours of daylight during a year
Some models are almost exact (for example, a Ferris wheel turns at a constant speed). Other models are only approximate (for example, the temperature in a city changes a little from year to year).
In Section 14.8 you met the general function \(y = a\sin\big(b(x - c)\big) + d\). In a model the variable is usually time \(t\).
Finding the parameters of a sinusoidal model Not in the formula booklet
For \(y = a\sin\big(b(t - c)\big) + d\) or \(y = a\cos\big(b(t - c)\big) + d\) with \(b > 0\):
\[ |a| = \frac{\max - \min}{2}, \qquad d = \frac{\max + \min}{2}, \qquad b = \frac{2\pi}{\text{period}} \]
- \(|a|\): the amplitude (half the distance from a minimum to a maximum)
- \(d\): the value on the principal axis \(y = d\) (the middle of the motion)
- \(b\): the number of cycles in \(2\pi\) units of time; the period is \(\dfrac{2\pi}{b}\)
- \(c\): the horizontal shift. For sine, \(t = c\) is a time when \(y = d\) and \(y\) is increasing. For cosine (with \(a > 0\)), \(t = c\) is a time of a maximum.
A sine curve reaches its maximum a quarter of a period after it crosses the principal axis going up. So if a maximum is at \(t = t_{\max}\), one possible value is \(c = t_{\max} - \dfrac{\text{period}}{4}\) (sine) or \(c = t_{\max}\) (cosine).
Building a model from data
Example 1 The depth of water in a harbour was recorded over two days. The times of high and low tide are shown below. At every high tide the depth was \(7.4\) m, and at every low tide it was \(1.6\) m.
| High tide | Low tide | |||
|---|---|---|---|---|
| Day 1 | 4:00 a.m. | 4:20 p.m. | 10:20 a.m. | 10:40 p.m. |
| Day 2 | 5:00 a.m. | 11:20 a.m. |
Let \(t\) be the time in hours after midnight at the start of Day 1, and let \(D\) be the depth in metres.
(a) Find a model of the form \(D = a\sin\big(b(t - c)\big) + d\), where \(a > 0\), \(b > 0\) and \(0 \leq c < 12\). Use the first high tide to find \(c\).
(b) Use your model to estimate the depth at 1:00 p.m. on Day 1.
(c) A boat can enter the harbour only when the depth is at least \(6\) m. Find the times on Day 1 when the boat can enter. Give your answers to the nearest minute.
(a) Amplitude and principal axis.
\[ a = \frac{7.4 - 1.6}{2} = 2.9, \qquad d = \frac{7.4 + 1.6}{2} = 4.5 . \]
Period. The times between high tides are 12 h 20 min and 12 h 40 min. The times between low tides are also 12 h 20 min and 12 h 40 min. The mean is \(12.5\) hours, so
\[ b = \frac{2\pi}{12.5} = \frac{4\pi}{25} \approx 0.503 . \]
Shift. The first maximum is at \(t = 4\). A sine curve reaches its maximum a quarter period (\(12.5 \div 4 = 3.125\) hours) after it crosses the principal axis going up, so
\[ c = 4 - 3.125 = 0.875 . \]
\[ D = 2.9\sin\left(\frac{4\pi}{25}(t - 0.875)\right) + 4.5 \]
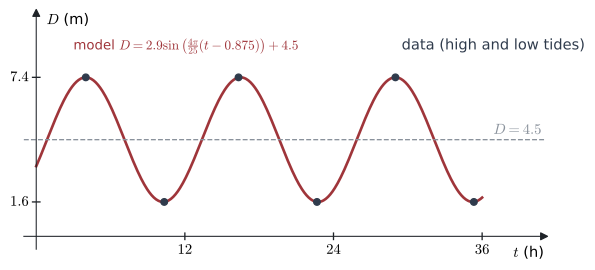
The model and the data are shown in Figure 1. The model is close to the data, but not exact: for example, it puts the first low tide at \(t = 10.25\) (10:15 a.m.), not 10:20 a.m.
(b) 1:00 p.m. is \(t = 13\). In radian mode,
\[ D = 2.9\sin\left(\frac{4\pi}{25} \times 12.125\right) + 4.5 \approx 3.96 \text{ m}. \]
(c) Solve \(D \geq 6\):
\[ \sin\left(\frac{4\pi}{25}(t - 0.875)\right) \geq \frac{6 - 4.5}{2.9} = 0.51724\ldots \]
Let \(u = \dfrac{4\pi}{25}(t - 0.875)\). For \(0 \leq t \leq 24\), \(u\) goes from about \(-0.44\) to \(11.6\). The basic solution is \(\arcsin(0.51724) = 0.54362\), so
\[ 0.54362 \leq u \leq \pi - 0.54362 \quad\text{or}\quad 2\pi + 0.54362 \leq u \leq 3\pi - 0.54362 . \]
Change back with \(t = 0.875 + \dfrac{25u}{4\pi}\):
\[ 1.957 \leq t \leq 6.043 \quad\text{or}\quad 14.457 \leq t \leq 18.543 . \]
The boat can enter from 1:57 a.m. to 6:03 a.m. and from 2:27 p.m. to 6:33 p.m.
The same tide can also be modelled with cosine. A cosine curve with \(a > 0\) starts at a maximum, so we can use the first high tide directly:
\[ D = 2.9\cos\left(\frac{4\pi}{25}(t - 4)\right) + 4.5 . \]
For Example 1 (c):
- Open a Graphs page. Check that RAD is shown at the top right (click on it to switch).
- Enter \(f_1(x) = 2.9\sin\left(\dfrac{4\pi}{25}(x - 0.875)\right) + 4.5\).
- Enter \(f_2(x) = 6\).
- Menu → Window / Zoom → Window Settings: \(x\) from \(0\) to \(24\), \(y\) from \(0\) to \(8\).
- Menu → Analyze Graph → Intersection. Click to the left of the first intersection (lower bound), then to the right of it (upper bound).
- Repeat step 5 for the other three intersections. You get \(x = 1.957\), \(6.043\), \(14.457\) and \(18.543\).
To fit a model to data directly:
- Put the times and depths in two columns of a Lists & Spreadsheet page.
- Menu → Statistics → Stat Calculations → Sinusoidal Regression.
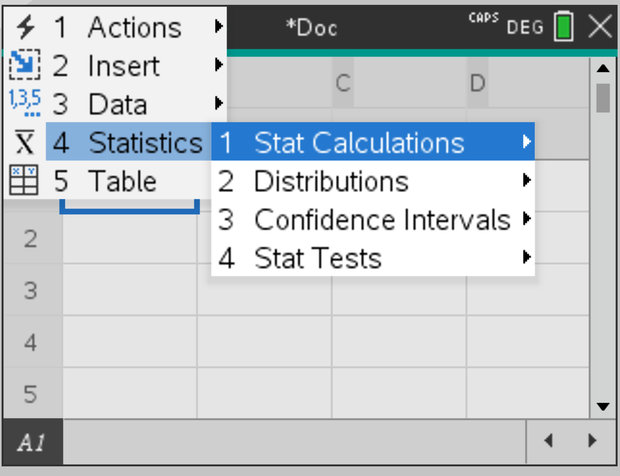
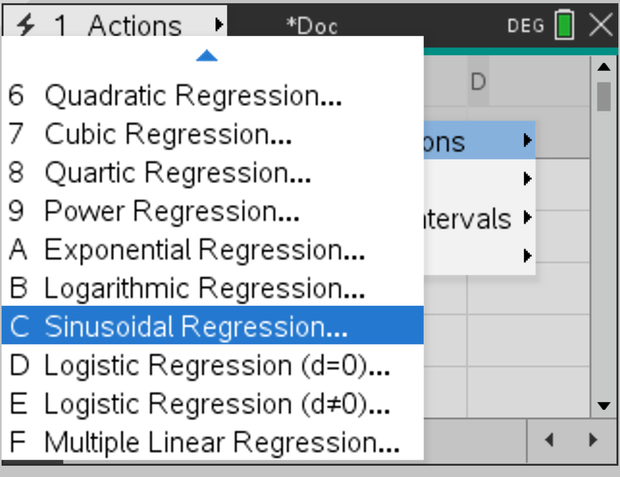
The calculator gives the result in the form \(y = a\sin(bx + c) + d\). This \(c\) is not the horizontal shift: \(bx + c = b\left(x + \frac{c}{b}\right)\), so the shift is \(-\dfrac{c}{b}\).
Using a given model
Example 2 A seat on a Ferris wheel is at its lowest point when \(t = 0\). Its height above the ground is \(h\) metres, where
\[ h = a\cos(kt) + 22, \qquad t \geq 0, \]
\(t\) is the time in minutes, and \(a\) and \(k\) are constants with \(k > 0\). At its lowest point the seat is \(2\) m above the ground. The seat takes \(6\) minutes to go from the lowest point to the highest point.
(a) Find the value of \(a\).
(b) Show that \(k = \dfrac{\pi}{6}\).
(c) Find the height of the seat at its highest point.
(d) Sketch the graph of \(h\) for \(0 \leq t \leq 24\).
(e) Find the time intervals in \(0 \leq t \leq 24\) when the seat is more than \(32\) m above the ground.
(a) At \(t = 0\), \(\cos 0 = 1\), so \(h = a + 22 = 2\). Hence \(a = -20\).
(b) Lowest point to highest point is half a cycle, so the period is \(2 \times 6 = 12\) minutes.
\[ \frac{2\pi}{k} = 12 \;\Longrightarrow\; k = \frac{2\pi}{12} = \frac{\pi}{6} . \]
(c) The greatest value of \(-20\cos(kt)\) is \(20\) (when \(\cos(kt) = -1\)). So the highest point is \(20 + 22 = 42\) m.
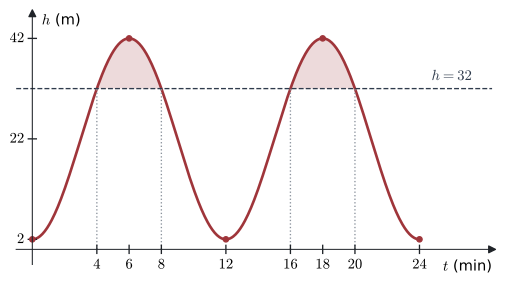
(d) \(h = 22 - 20\cos\left(\dfrac{\pi t}{6}\right)\): minimum \(2\) at \(t = 0, 12, 24\); maximum \(42\) at \(t = 6, 18\); principal axis \(h = 22\). See Figure 2.
(e) Solve \(22 - 20\cos\left(\dfrac{\pi t}{6}\right) > 32\):
\[ -20\cos\left(\frac{\pi t}{6}\right) > 10 \;\Longrightarrow\; \cos\left(\frac{\pi t}{6}\right) < -\frac{1}{2} . \]
Let \(u = \dfrac{\pi t}{6}\). For \(0 \leq t \leq 24\), \(0 \leq u \leq 4\pi\). Now \(\cos u = -\frac{1}{2}\) at \(u = \frac{2\pi}{3}, \frac{4\pi}{3}, \frac{8\pi}{3}, \frac{10\pi}{3}\), and \(\cos u < -\frac{1}{2}\) between each pair:
\[ \frac{2\pi}{3} < u < \frac{4\pi}{3} \quad\text{or}\quad \frac{8\pi}{3} < u < \frac{10\pi}{3} . \]
Multiply by \(\dfrac{6}{\pi}\): \(\;4 < t < 8\;\) or \(\;16 < t < 20\). The seat is above \(32\) m for \(4\) minutes in each turn (the shaded parts of Figure 2).
Common errors
| ✗ Wrong | ✓ Right | Why |
|---|---|---|
| amplitude \(= \max - \min\) | \(\dfrac{\max - \min}{2}\) | The amplitude is measured from the middle, not from the bottom. |
| \(b = \text{period}\) | \(b = \dfrac{2\pi}{\text{period}}\) | \(b\) is the number of cycles in \(2\pi\), not the length of one cycle. |
| Lowest to highest point \(= 1\) period | \(\frac{1}{2}\) period | Lowest to highest is only half a turn. |
| Sine model: \(c =\) time of the maximum | \(c = t_{\max} - \frac{\text{period}}{4}\) | A sine curve starts on the principal axis, going up. |
| Calculator in degree mode | Radian mode | With \(b = \frac{4\pi}{25}\) the angle \(b(t - c)\) is in radians. |
| Answering “\(t = 1.957\)” for a time of day | “1:57 a.m.” | \(0.957\) h is \(57\) minutes, not \(95.7\) minutes. |
Exercises
1 A function \(f(t) = a\sin(bt) + d\), with \(a > 0\) and \(b > 0\), has maximum value \(11\), minimum value \(3\) and period \(8\). Find \(a\), \(b\) and \(d\).
\(a = \dfrac{11 - 3}{2} = 4\), \(\;d = \dfrac{11 + 3}{2} = 7\), \(\;b = \dfrac{2\pi}{8} = \dfrac{\pi}{4}\).
2 The height of a buoy is \(h(t) = 3\cos\left(\dfrac{\pi}{6}(t - 2)\right) + 10\) metres, where \(t\) is in hours. State the maximum height, the minimum height, the period, and the first time \(t \geq 0\) when the height is a maximum.
Maximum \(10 + 3 = 13\) m, minimum \(10 - 3 = 7\) m. Period \(= \dfrac{2\pi}{\pi/6} = 12\) hours. A cosine curve with \(a > 0\) has a maximum when the bracket is \(0\), so at \(t = 2\).
3 The mean daily temperature in a city is modelled by \(T = 6\sin\left(\dfrac{\pi}{6}(m - 4)\right) + 24\) °C, where \(m\) is the month (\(m = 1\) for January, \(m = 12\) for December).
(a) Find the temperature predicted for July (\(m = 7\)).
(b) Find the lowest temperature predicted by the model, and the month in which it happens.
(a) \(T = 6\sin\left(\dfrac{\pi}{6} \times 3\right) + 24 = 6\sin\dfrac{\pi}{2} + 24 = 30\) °C.
(b) The lowest value is \(24 - 6 = 18\) °C, when \(\sin\left(\frac{\pi}{6}(m - 4)\right) = -1\), that is \(\frac{\pi}{6}(m - 4) = -\frac{\pi}{2}\), so \(m = 1\): January.
4 A Ferris wheel has diameter \(30\) m, and its centre is \(18\) m above the ground. It turns once every \(10\) minutes. A seat is at the lowest point at \(t = 0\).
(a) Show that the height of the seat is \(h = 18 - 15\cos\left(\dfrac{\pi t}{5}\right)\) metres after \(t\) minutes.
(b) Find the height of the seat after \(2.5\) minutes and after \(\dfrac{10}{3}\) minutes.
(a) The amplitude is the radius, \(15\) m, and the principal axis is \(h = 18\). The period is \(10\), so \(b = \dfrac{2\pi}{10} = \dfrac{\pi}{5}\). The lowest point is \(18 - 15 = 3\) m. At \(t = 0\), \(\cos 0 = 1\), so \(h(0) = 18 - 15 = 3\): the seat starts at the bottom. ✓
(b) \(h(2.5) = 18 - 15\cos\dfrac{\pi}{2} = 18\) m. \(\quad h\left(\dfrac{10}{3}\right) = 18 - 15\cos\dfrac{2\pi}{3} = 18 + 7.5 = 25.5\) m.
5 The number of hours of daylight in a town is modelled by \(D(t) = 12 + 2.5\sin\left(\dfrac{2\pi}{365}(t - 80)\right)\), where \(t\) is the day of the year. Find the greatest number of hours of daylight, and the day on which it happens.
The greatest value is \(12 + 2.5 = 14.5\) hours, when \(\dfrac{2\pi}{365}(t - 80) = \dfrac{\pi}{2}\):
\[ t - 80 = \frac{365}{4} = 91.25 \;\Longrightarrow\; t = 171.25 , \]
so on day 171.
6 The depth of water at a jetty is \(d(t) = 5 + 2\cos\left(\dfrac{\pi t}{6}\right)\) metres, \(t\) hours after midnight.
(a) Write down the depth at high tide, and the first time it happens.
(b) A yacht needs a depth of at least \(6\) m. Find the times in \(0 \leq t \leq 24\) when the yacht can use the jetty.
(a) \(7\) m, at \(t = 0\) (midnight).
(b) \(5 + 2\cos\left(\frac{\pi t}{6}\right) \geq 6 \iff \cos u \geq \frac{1}{2}\) with \(u = \frac{\pi t}{6}\), \(0 \leq u \leq 4\pi\):
\[ \begin{gathered} 0 \leq u \leq \frac{\pi}{3}, \qquad \frac{5\pi}{3} \leq u \leq \frac{7\pi}{3}, \\ \frac{11\pi}{3} \leq u \leq 4\pi . \end{gathered} \]
So \(0 \leq t \leq 2\), \(\;10 \leq t \leq 14\), \(\;22 \leq t \leq 24\): from midnight to 2 a.m., from 10 a.m. to 2 p.m., and from 10 p.m. to midnight.
7 A quantity \(y\) has a maximum value of \(9\) at \(t = 1\), and the next minimum value is \(1\) at \(t = 4\). Find a model \(y = a\sin\big(b(t - c)\big) + d\) with \(a > 0\), \(b > 0\) and \(0 \leq c < 6\).
\(a = 4\), \(d = 5\). Maximum to minimum is half a period, so the period is \(6\) and \(b = \dfrac{2\pi}{6} = \dfrac{\pi}{3}\).
The sine curve crosses the axis going up a quarter period (\(1.5\)) before the maximum: \(c = 1 - 1.5 = -0.5\). Add one period to get \(0 \leq c < 6\): \(c = 5.5\).
\[ y = 4\sin\left(\frac{\pi}{3}(t - 5.5)\right) + 5 . \]
Check: \(t = 1\) gives \(\sin\left(-\frac{3\pi}{2}\right) = 1\), so \(y = 9\). ✓
8 Paper 2 The height of a wave is \(H(t) = 1.8\sin(0.5t) + 3.2\) metres, \(t\) seconds after a measurement starts. Find the values of \(t\) in \(0 \leq t \leq 12\) when \(H = 4\). Give your answers to 3 significant figures.
\(\sin(0.5t) = \dfrac{4 - 3.2}{1.8} = 0.4444\ldots\) For \(0 \leq t \leq 12\), \(\;0 \leq 0.5t \leq 6\).
\[ 0.5t = 0.46055 \quad\text{or}\quad 0.5t = \pi - 0.46055 = 2.6810 . \]
(The next one, \(2\pi + 0.46055 = 6.74\), is more than \(6\).) So \(t = 0.921\) or \(t = 5.36\).
9 The length of a spring is \(L = 25 - 4\cos(\pi t)\) cm, \(t\) seconds after it is released.
(a) Find the shortest and the longest length.
(b) Find the first time when \(L = 27\).
(c) For how long in each cycle is the spring longer than \(27\) cm?
(a) Shortest \(25 - 4 = 21\) cm, longest \(25 + 4 = 29\) cm.
(b) \(-4\cos(\pi t) = 2 \Rightarrow \cos(\pi t) = -\dfrac{1}{2} \Rightarrow \pi t = \dfrac{2\pi}{3} \Rightarrow t = \dfrac{2}{3}\) s.
(c) The period is \(\dfrac{2\pi}{\pi} = 2\) s. \(L > 27\) when \(\cos(\pi t) < -\frac{1}{2}\), that is \(\frac{2\pi}{3} < \pi t < \frac{4\pi}{3}\), so \(\frac{2}{3} < t < \frac{4}{3}\). That is \(\dfrac{2}{3}\) s in each cycle.
10 The graph of \(f(x) = p\sin(qx) + r\), with \(p > 0\) and \(q > 0\), has a maximum point at \(\left(\dfrac{\pi}{8}, 7\right)\), and the next minimum point is \(\left(\dfrac{3\pi}{8}, -1\right)\). Find \(p\), \(q\) and \(r\).
\(p = \dfrac{7 - (-1)}{2} = 4\), \(\;r = \dfrac{7 + (-1)}{2} = 3\). Half a period is \(\dfrac{3\pi}{8} - \dfrac{\pi}{8} = \dfrac{\pi}{4}\), so the period is \(\dfrac{\pi}{2}\) and \(q = \dfrac{2\pi}{\pi/2} = 4\).
Check: \(f\left(\frac{\pi}{8}\right) = 4\sin\frac{\pi}{2} + 3 = 7\). ✓