Unit 15 Exam Practice
Statistics
These questions are written in the style of IB examination questions, and they are harder than the review exercises. The marks for each part are shown in square brackets on the right, for example [3]. Paper 1 means no calculator; Paper 2 means a graphic display calculator (GDC) is allowed. Try each question under exam conditions first, then open the markscheme.
| Mark | Meaning |
|---|---|
| M | Method mark: a correct method is used, even with a small slip |
| A | Accuracy mark: a correct answer or line of working (usually needs the M mark before it) |
| R | Reasoning mark: a clear reason or justification is given |
| N | Mark for a correct final answer with no working shown |
| AG | “Answer given” in the question, so no extra mark is awarded for writing it |
The number after the letter is the number of marks, so A2 is worth 2 marks. In the exam, give answers exactly or correct to 3 significant figures (s.f.) unless the question says otherwise.
SL questions
SL 1 Paper 1
A sports club has \(840\) members: \(252\) juniors, \(420\) adults and \(168\) seniors.
(a) A stratified sample of \(60\) members is taken. Find the number of juniors, adults and seniors in the sample. [2]
Instead, a systematic sample of \(60\) members is taken from the membership list, which is numbered from \(1\) to \(840\). The last member chosen is number \(835\).
(b) Find the number of the first member chosen. [2]
(c) In the membership list, the juniors are numbers \(1\) to \(252\). Show that the systematic sample contains the same number of juniors as the stratified sample in part (a). [2]
(d) The club secretary emails a questionnaire to all \(840\) members and uses the first \(60\) replies. Name this sampling method, and give one reason why the sample may be biased. [2]
Total 8 marks
(a)
\(\dfrac{252}{840} \times 60\) (or the sampling fraction \(\dfrac{60}{840} = \dfrac{1}{14}\)) M1
\(18\) juniors, \(30\) adults, \(12\) seniors A1
[2 marks]
(b)
interval \(k = \dfrac{840}{60} = 14\), so \(r + 59 \times 14 = 835\) M1
\(r = 835 - 826 = 9\) A1
[2 marks]
(c)
members chosen: \(9 + 14j\), \(j = 0, 1, \ldots, 59\); junior if \(9 + 14j \le 252\), so \(j \le 17.4\) M1
\(j = 0, 1, \ldots, 17\): \(18\) juniors, the same as in part (a) A1
[2 marks]
(d)
convenience sampling A1
members who reply first (for example, those with more free time or a stronger interest in the club) may not represent all members R1
Accept self-selected (volunteer) sampling. Accept any sensible reason in context, for example members who rarely read email are not represented.
[2 marks]
See 15.1.
SL 2 Paper 2
The table shows the number of people, \(x\), who live in each of the \(30\) flats in a building.
| \(x\) | 1 | 2 | 3 | 4 | 5 | 6 |
|---|---|---|---|---|---|---|
| Frequency | 2 | \(a\) | 10 | \(b\) | 3 | 2 |
The mean number of people per flat is \(3.1\).
(a) Find the value of \(a\) and the value of \(b\). [3]
(b) Find the standard deviation of \(x\). [2]
(c) Each flat pays a monthly water charge of \((15x + 8)\) dollars. Find the mean and the standard deviation of the monthly water charges. [2]
Total 7 marks
(a)
\(2 + a + 10 + b + 3 + 2 = 30\), so \(a + b = 13\) A1
\(\sum fx = 2 + 2a + 30 + 4b + 15 + 12 = 3.1 \times 30 = 93\) M1
\(2a + 4b = 34\), so \(a = 9\) and \(b = 4\) A1
[3 marks]
(b)
\(x = 1, \ldots, 6\) with frequencies \(2, 9, 10, 4, 3, 2\) (using One-Variable Statistics on a GDC) M1
\(\sigma = 1.3\) A1
Accept working by hand: \(\sigma^{2} = \dfrac{339}{30} - 3.1^{2} = 1.69\). Do not award A1 for \(s_x = 1.32\).
[2 marks]
(c)
mean \(= 15 \times 3.1 + 8 = 54.5\) dollars A1
standard deviation \(= 15 \times 1.3 = 19.5\) dollars A1
[2 marks]
SL 3 Paper 1
Seven positive integers are written in order of size. For these seven integers:
- the smallest integer is \(2\);
- the only mode is \(4\), the median is \(6\) and the mean is \(7\);
- the range is \(12\) and the interquartile range is \(7\).
(a) Find the seven integers. [4]
(b) Determine whether the largest integer is an outlier. [2]
An eighth positive integer \(n\) is added to the list. The mean of the eight integers is \(8\).
(c) Find \(n\). [2]
Total 8 marks
(a)
in order \(2,\ 4,\ 4,\ 6,\ x_5,\ x_6,\ 14\): median \(6\), at least two \(4\)s below it, largest \(= 2 + 12\) M1
sum \(= 7 \times 7 = 49\), so \(x_5 + x_6 = 49 - 30 = 19\) M1
\(Q_1 = 4\) and \(Q_3 = x_6\), so \(x_6 - 4 = 7\), giving \(x_6 = 11\) A1
\(x_5 = 8\): the integers are \(2,\ 4,\ 4,\ 6,\ 8,\ 11,\ 14\) A1
With \(7\) values, the median is left out of each half: \(Q_1\) is the median of \(2, 4, 4\) and \(Q_3\) is the median of \(8, 11, 14\).
[4 marks]
(b)
\(Q_3 + 1.5 \times \mathrm{IQR} = 11 + 10.5 = 21.5\) M1
\(14 < 21.5\), so \(14\) is not an outlier A1
[2 marks]
(c)
the sum of the eight integers is \(8 \times 8 = 64\) M1
\(n = 64 - 49 = 15\) A1
[2 marks]
SL 4 Paper 2
The cumulative frequency graph shows the times, \(t\) minutes, that \(200\) visitors spent in a museum on one day.
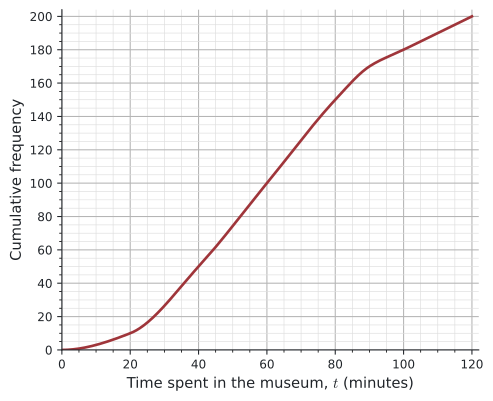
(a) Write down the median time. [1]
(b) Find the interquartile range. [2]
(c) The museum gives a free coffee to the \(15\%\) of visitors who stayed the longest. Find the shortest time that a visitor had to stay to receive a free coffee. [2]
The times are grouped in the frequency table.
| Time, \(t\) (minutes) | Frequency |
|---|---|
| \(0 \le t < 20\) | 10 |
| \(20 \le t < 40\) | \(p\) |
| \(40 \le t < 60\) | 50 |
| \(60 \le t < 80\) | 50 |
| \(80 \le t < 100\) | \(q\) |
| \(100 \le t < 120\) | 20 |
(d) Write down the value of \(p\) and the value of \(q\). [2]
(e) Find an estimate of the mean and of the standard deviation of the times. [3]
The shortest time was \(4\) minutes and the longest time was \(118\) minutes.
(f) Draw a box-and-whisker diagram of the times, on a horizontal scale from \(0\) to \(120\) minutes. [3]
(g) Show that there are no outliers in the data. [2]
Total 15 marks
(a)
across from \(\dfrac{200}{2} = 100\): median \(= 60\) minutes A1
[1 mark]
(b)
across from \(50\) and \(150\): \(Q_1 = 40\) and \(Q_3 = 80\) M1
\(\text{IQR} = 80 - 40 = 40\) minutes A1
[2 marks]
(c)
\(85\%\) of \(200\) is \(170\); go across from \(170\) M1
\(t = 90\) minutes A1
[2 marks]
(d)
\(p = 50 - 10 = 40\) A1
\(q = 180 - 150 = 30\) A1
[2 marks]
(e)
mid-interval values \(10, 30, 50, 70, 90, 110\) with the frequencies (using One-Variable Statistics on a GDC) M1
mean \(\approx 61\) minutes A1
standard deviation \(\approx 27.2\) minutes \((27.1845\ldots)\) A1
Award M1 A0 A0 if class boundaries are used instead of mid-interval values.
[3 marks]
(f)
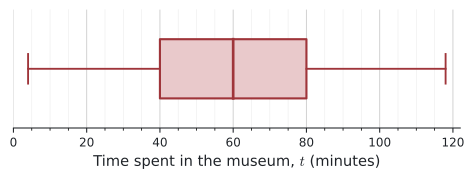
box from \(Q_1 = 40\) to \(Q_3 = 80\) A1
median line at \(60\) A1
whiskers from \(4\) to \(40\) and from \(80\) to \(118\) A1
[3 marks]
(g)
\(Q_1 - 1.5 \times 40 = -20\) and \(Q_3 + 1.5 \times 40 = 140\) A1
all times lie between \(4\) and \(118\), inside \(-20\) and \(140\), so there are no outliers R1
[2 marks]
SL 5 Paper 1
The stem-and-leaf diagram shows the times, in minutes, taken by the \(15\) runners in group A to complete a \(5\) km charity run. The leaf \(a\) is a digit.
1 | 8 9
2 | 3 5 5 7 9
3 | 0 2 a 6 8
4 | 1 4
5 |
6 | 7          Key: 3 | 2 means 32 minutes
(a) The mean time of the \(15\) runners is \(32.6\) minutes. Find the value of \(a\). [2]
(b) Find the median and the quartiles of the times. [3]
(c) Show that \(67\) is an outlier, and that there are no other outliers. [3]
It is later found that the time of \(67\) minutes was recorded wrongly. The correct time is \(37\) minutes.
(d) For the corrected data, find the mean and the upper quartile. [3]
The box-and-whisker diagram shows the times of the runners in group B.
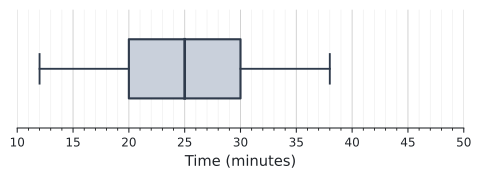
(e) Compare the corrected times of group A with the times of group B. [2]
(f) Explain whether the times of group B may be normally distributed. [2]
Total 15 marks
(a)
\(15 \times 32.6 = 489\), and the sum of the other \(14\) values plus \(30\) is \(484\), so \(484 + a = 489\) M1
\(a = 5\) A1
[2 marks]
(b)
\(n = 15\), so the median is the \(8\)th value: median \(= 30\) A1
lower half \(18, 19, 23, 25, 25, 27, 29\): \(Q_1 = 25\) A1
upper half \(32, 35, 36, 38, 41, 44, 67\): \(Q_3 = 38\) A1
[3 marks]
(c)
\(\text{IQR} = 38 - 25 = 13\), and \(1.5 \times 13 = 19.5\) M1
boundaries: \(25 - 19.5 = 5.5\) and \(38 + 19.5 = 57.5\) A1
\(67 > 57.5\), so \(67\) is an outlier; all the other values are between \(18\) and \(44\), so they are not outliers R1
[3 marks]
(d)
new mean \(= \dfrac{489 - 30}{15} = \dfrac{459}{15}\) M1
\(= 30.6\) minutes A1
upper half is now \(32, 35, 36, 37, 38, 41, 44\), so \(Q_3 = 37\) A1
[3 marks]
(e)
the median of group A (\(30\) min) is greater than the median of group B (\(25\) min), so the runners in group A usually took longer A1
the IQR of group A (\(37 - 25 = 12\) min) is greater than that of group B (\(30 - 20 = 10\) min), so the times of group A are more spread out A1
Accept a comparison of the ranges (\(26\) min for both groups) for the second A1 only if it is in context. The comparison must refer to the context (times of the runners).
[2 marks]
(f)
whiskers \(20 - 12 = 8\) and \(38 - 30 = 8\); halves of the box \(5\) and \(5\), so the box plot is symmetric A1
it is symmetric and the whiskers are longer than each half of the box, so the times may be normally distributed R1
[2 marks]
HL questions
This unit has no AHL content, so the HL questions test the same syllabus content as SL, but they need longer chains of algebra and reasoning.
HL 1 Paper 1
Eight data values are \[ 9, \quad 11, \quad 13, \quad 15, \quad 16, \quad 18, \quad a, \quad b, \qquad \text{where } a < b . \] The mean of the eight values is \(15\) and the variance is \(42.5\).
(a) Show that \(a + b = 38\) and \(a^{2} + b^{2} = 964\). [2]
(b) Find the value of \(a\) and the value of \(b\). [3]
(c) Show that exactly one of the eight values is an outlier. [3]
Total 8 marks
(a)
\(82 + a + b = 8 \times 15 = 120\), so \(a + b = 38\) A1
\(\sum x^{2} = 8\left(42.5 + 15^{2}\right) = 2140\) M1
\(a^{2} + b^{2} = 2140 - 1176 = 964\) AG
[2 marks]
(b)
\(a^{2} + (38 - a)^{2} = 964\) M1
\(2a^{2} - 76a + 480 = 0\), so \(a^{2} - 38a + 240 = 0\) A1
\((a - 8)(a - 30) = 0\); since \(a < b\), \(a = 8\) and \(b = 30\) A1
[3 marks]
(c)
in order: \(8, 9, 11, 13, 15, 16, 18, 30\); \(Q_1 = \dfrac{9 + 11}{2} = 10\), \(Q_3 = \dfrac{16 + 18}{2} = 17\) M1
\(\text{IQR} = 7\); boundaries \(10 - 10.5 = -0.5\) and \(17 + 10.5 = 27.5\) A1
only \(30 > 27.5\) (and no value is below \(-0.5\)), so exactly one value is an outlier R1
[3 marks]
HL 2 Paper 1
The marks, \(x\), of the students in a test have mean \(48\) and standard deviation \(12\). The teacher scales every mark using \(y = px + q\), where \(p > 0\), so that the scaled marks have mean \(60\) and standard deviation \(9\).
(a) Find the value of \(p\) and the value of \(q\). [3]
(b) One student’s mark is not changed by the scaling. Find this mark. [2]
(c) Outliers are found with the \(1.5 \times \text{IQR}\) rule. Show that a mark is an outlier among the original marks exactly when its scaled mark is an outlier among the scaled marks. [3]
Total 8 marks
(a)
\(12p = 9\) (the standard deviation is multiplied by \(|p| = p\)) M1
\(p = \dfrac{3}{4}\) A1
\(\dfrac{3}{4} \times 48 + q = 60\), so \(q = 24\) A1
[3 marks]
(b)
\(x = \dfrac{3}{4}x + 24\) M1
\(x = 96\) A1
[2 marks]
(c)
\(p > 0\), so the scaling keeps the order of the marks; hence the scaled quartiles are \(pQ_1 + q\) and \(pQ_3 + q\) R1
the scaled IQR is \((pQ_3 + q) - (pQ_1 + q) = p \times \text{IQR}\) A1
\(px + q > pQ_3 + q + 1.5p \times \text{IQR} \iff x > Q_3 + 1.5 \times \text{IQR}\), dividing by \(p > 0\); the lower boundary works in the same way R1
[3 marks]
HL 3 Paper 1
A company has \(600\) employees in three departments: \(120\) in department A, \(300\) in department B and \(180\) in department C.
(a) A stratified sample of \(40\) employees is taken. Find the number of employees chosen from each department. [2]
The table shows the mean and the standard deviation of the commute times, in minutes, of the employees in the sample from each department.
| Department | A | B | C |
|---|---|---|---|
| Mean (minutes) | 31 | 30 | 36 |
| Standard deviation (minutes) | 7 | 6 | 2 |
(b) Find the mean commute time of all \(40\) employees in the sample. [2]
(c) Find the standard deviation of the commute times of all \(40\) employees in the sample. [4]
Total 8 marks
(a)
\(\dfrac{120}{600} \times 40\), \(\dfrac{300}{600} \times 40\), \(\dfrac{180}{600} \times 40\) M1
\(8\) from A, \(20\) from B, \(12\) from C A1
[2 marks]
(b)
\(\dfrac{8 \times 31 + 20 \times 30 + 12 \times 36}{40} = \dfrac{1280}{40}\) M1
\(= 32\) minutes A1
[2 marks]
(c)
for each department, \(\sum x^{2} = n\left(\sigma^{2} + \bar{x}^{2}\right)\), for example \(8\left(7^{2} + 31^{2}\right)\) M1
\(8080 + 18\,720 + 15\,600 = 42\,400\) A1
\(\sigma^{2} = \dfrac{42\,400}{40} - 32^{2} = 1060 - 1024 = 36\) M1
\(\sigma = 6\) minutes A1
Do not award the final A1 for \(\sqrt{\dfrac{8(49) + 20(36) + 12(4)}{40}}\), which ignores the different means.
[4 marks]
HL 4 Paper 2
The histogram shows the masses, \(m\) grams, of \(80\) tomatoes from Farm A.
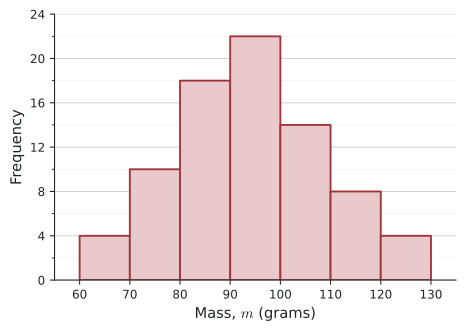
(a) Find an estimate of the mean and of the standard deviation of the masses. [3]
(b) Explain why the median mass lies in the class \(90 \le m < 100\). [2]
For the exact masses, \(Q_1 = 84\) g and \(Q_3 = 103\) g. The lightest tomato has a mass of \(61\) g and the heaviest has a mass of \(128\) g.
(c) Show that there are no outliers in the masses. [3]
The exact mean and standard deviation of the \(80\) masses from Farm A are \(93.5\) g and \(14.5\) g. The masses of \(120\) tomatoes from Farm B have mean \(99\) g and standard deviation \(12\) g.
(d) Compare the masses of the tomatoes from the two farms. [2]
(e) Find the mean and the standard deviation of the masses of all \(200\) tomatoes. [5]
Total 15 marks
(a)
frequencies \(4, 10, 18, 22, 14, 8, 4\) with mid-interval values \(65, 75, \ldots, 125\) (using One-Variable Statistics on a GDC) M1
mean \(\approx 94.0\) g A1
standard deviation \(\approx 14.8\) g \((14.7986\ldots)\) A1
[3 marks]
(b)
\(n = 80\), so the median is halfway between the \(40\)th and \(41\)st masses A1
\(4 + 10 + 18 = 32\) masses are below \(90\) g and \(32 + 22 = 54\) are below \(100\) g, so the \(40\)th and \(41\)st masses are both in this class R1
[2 marks]
(c)
\(\text{IQR} = 103 - 84 = 19\), and \(1.5 \times 19 = 28.5\) M1
boundaries: \(84 - 28.5 = 55.5\) and \(103 + 28.5 = 131.5\) A1
\(61 > 55.5\) and \(128 < 131.5\), so every mass lies inside the boundaries: no outliers R1
[3 marks]
(d)
the mean for Farm B (\(99\) g) is greater than for Farm A (\(93.5\) g), so Farm B’s tomatoes are heavier on average A1
the standard deviation for Farm B (\(12\) g) is smaller than for Farm A (\(14.5\) g), so the masses of Farm B’s tomatoes are more consistent A1
[2 marks]
(e)
mean \(= \dfrac{80 \times 93.5 + 120 \times 99}{200} = \dfrac{19\,360}{200}\) M1
\(= 96.8\) g A1
\(\sum m^{2} = 80\left(14.5^{2} + 93.5^{2}\right) + 120\left(12^{2} + 99^{2}\right)\) M1
\(= 716\,200 + 1\,193\,400 = 1\,909\,600\) A1
\(\sigma^{2} = \dfrac{1\,909\,600}{200} - 96.8^{2} = 177.76\)
\(\sigma = 13.3\) g \((13.3326\ldots)\) A1
[5 marks]
HL 5 Paper 1
A data set \(x_1, x_2, \ldots, x_n\) has mean \(\mu\) and variance \(\sigma^{2}\). One extra value, \(v\), is added to the data set. Let \(\mu'\) and \(\sigma'^{2}\) be the mean and the variance of the \(n + 1\) values.
(a) In the case \(v = \mu\), show that \(\mu' = \mu\) and \(\sigma'^{2} = \dfrac{n\sigma^{2}}{n + 1}\). [3]
(b) For any value of \(v\), show that \[ \mu' = \frac{n\mu + v}{n + 1} \qquad \text{and} \qquad \sigma'^{2} = \frac{n}{n + 1}\left(\sigma^{2} + \frac{(v - \mu)^{2}}{n + 1}\right). \] [5]
(c) Hence show that if \(\sigma > 0\) and \(v\) is within one standard deviation of the mean, that is \(|v - \mu| \le \sigma\), then \(\sigma'^{2} < \sigma^{2}\). [3]
A data set of \(9\) values has mean \(50\) and standard deviation \(4\). A tenth value, \(v\), is added, and the standard deviation of the \(10\) values is \(4.2\).
(d) Find the two possible values of \(v\), and the mean of the \(10\) values in each case. [4]
Total 15 marks
(a)
\(\mu' = \dfrac{n\mu + \mu}{n + 1} = \mu\) A1
\(\sum (x_i - \mu)^{2} = n\sigma^{2}\), and the new value adds \((\mu - \mu)^{2} = 0\) to this sum M1 R1
\(\sigma'^{2} = \dfrac{n\sigma^{2}}{n + 1}\) AG
[3 marks]
(b)
the sum of the \(n\) values is \(n\mu\), so \(\mu' = \dfrac{n\mu + v}{n + 1}\) A1
\(\sigma^{2} = \dfrac{\sum x_i^{2}}{n} - \mu^{2}\), so \(\sum x_i^{2} = n\left(\sigma^{2} + \mu^{2}\right)\) M1
\(\sigma'^{2} = \dfrac{n\sigma^{2} + n\mu^{2} + v^{2}}{n + 1} - \dfrac{(n\mu + v)^{2}}{(n + 1)^{2}}\) M1
\((n + 1)^{2}\sigma'^{2} = (n + 1)\left(n\sigma^{2} + n\mu^{2} + v^{2}\right) - (n\mu + v)^{2}\) A1
\(= n(n + 1)\sigma^{2} + n\mu^{2} - 2n\mu v + nv^{2}\) A1
\(= n(n + 1)\sigma^{2} + n(v - \mu)^{2}\), so \(\sigma'^{2} = \dfrac{n}{n + 1}\left(\sigma^{2} + \dfrac{(v - \mu)^{2}}{n + 1}\right)\) AG
[5 marks]
(c)
\(\sigma'^{2} - \sigma^{2} = \dfrac{n\sigma^{2}}{n + 1} + \dfrac{n(v - \mu)^{2}}{(n + 1)^{2}} - \sigma^{2}\) M1
\(= \dfrac{n(v - \mu)^{2} - (n + 1)\sigma^{2}}{(n + 1)^{2}}\) A1
if \((v - \mu)^{2} \le \sigma^{2}\), then \(n(v - \mu)^{2} \le n\sigma^{2} < (n + 1)\sigma^{2}\) (as \(\sigma^{2} > 0\)), so \(\sigma'^{2} - \sigma^{2} < 0\) R1
[3 marks]
(d)
\(\dfrac{9}{10}\left(16 + \dfrac{(v - 50)^{2}}{10}\right) = 4.2^{2} = 17.64\) M1
\(16 + \dfrac{(v - 50)^{2}}{10} = 19.6\), so \((v - 50)^{2} = 36\) A1
\(v = 44\) or \(v = 56\) A1
means: \(\dfrac{450 + 44}{10} = 49.4\) and \(\dfrac{450 + 56}{10} = 50.6\) A1
[4 marks]
See 15.3.